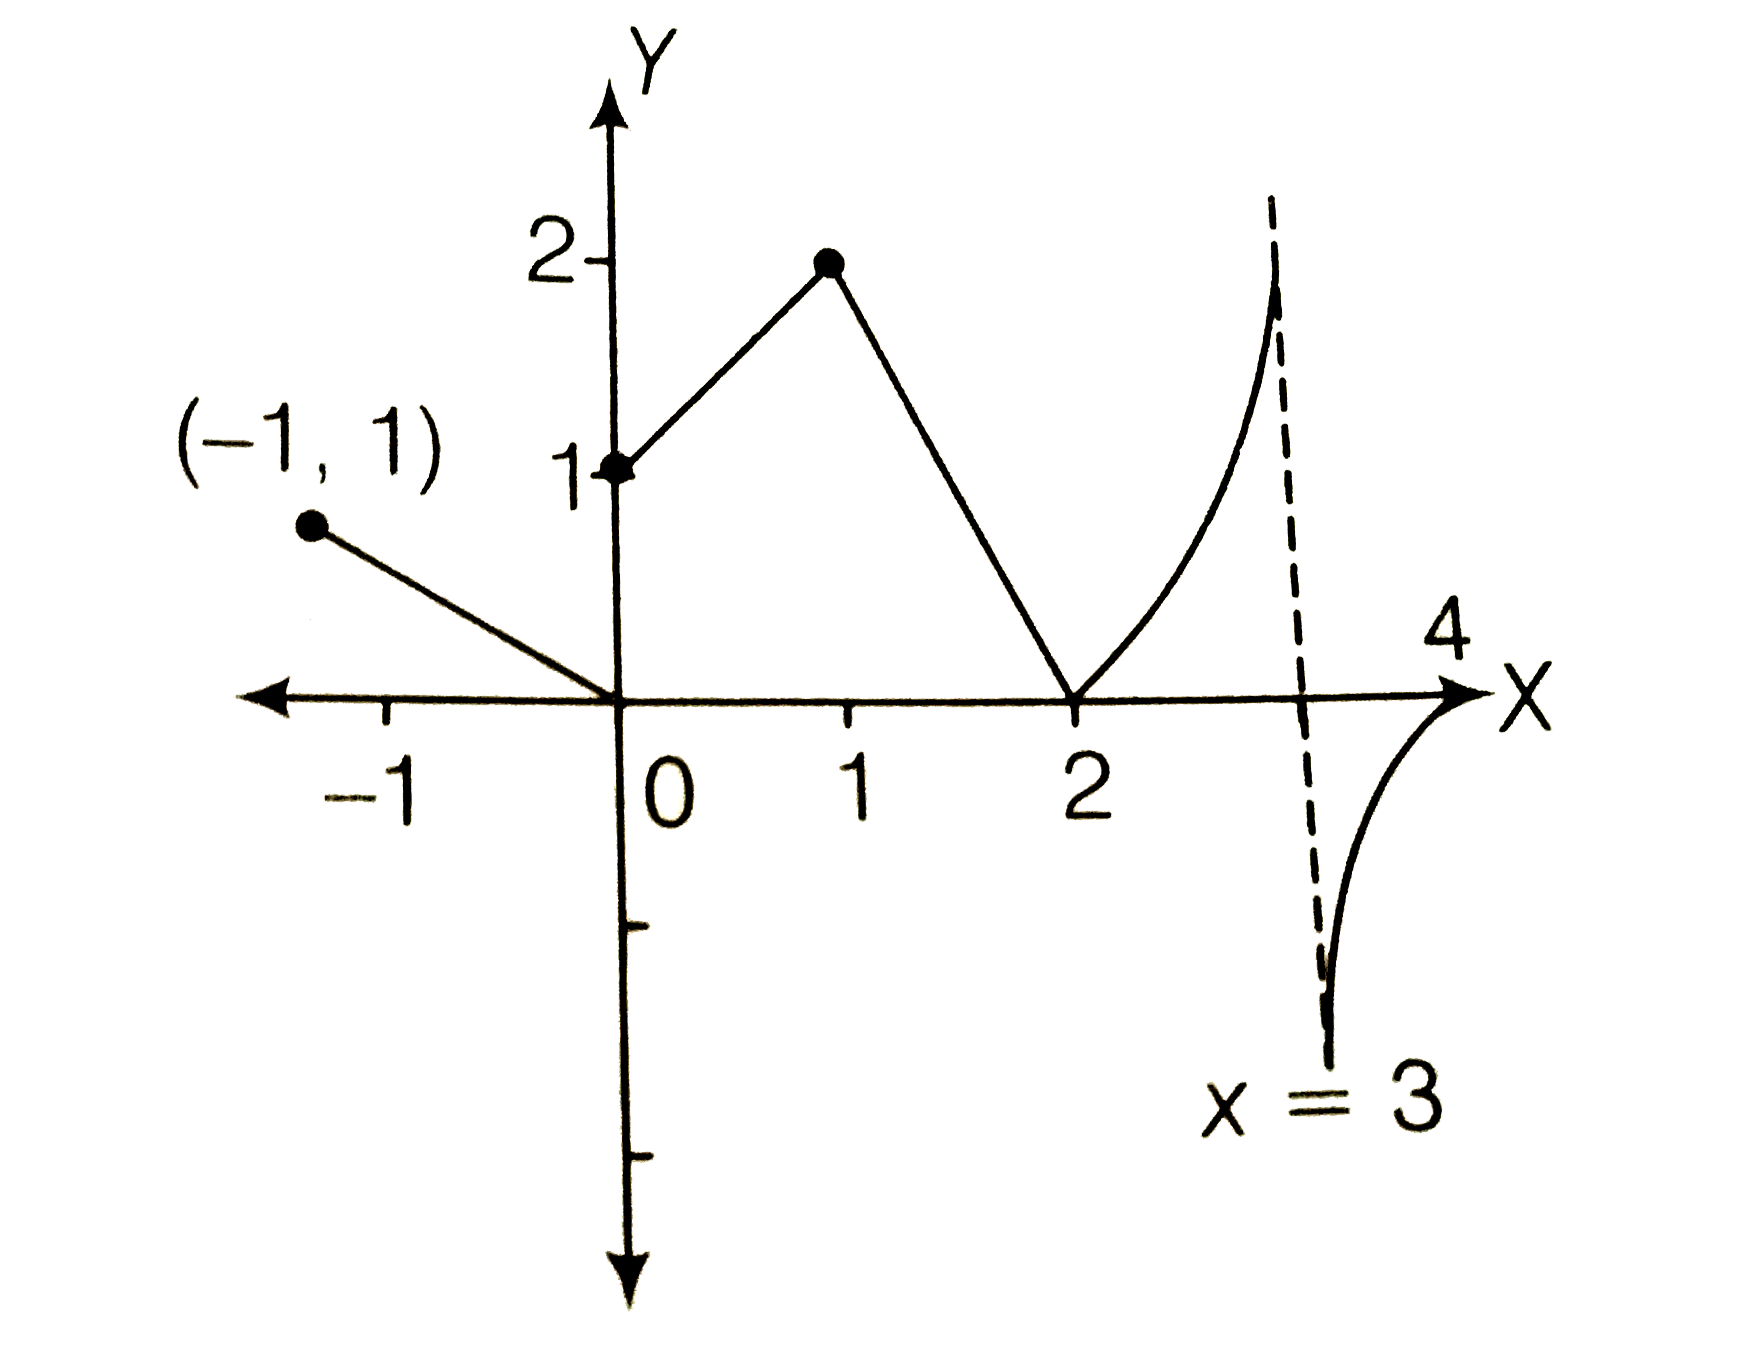
The graph of the function y=f(x) is shown in the adjacent figure then correct statement is
 Solution in Punjabi
limx→0+f(x)=1
limx→1f(x)=2
limx→3f(x)= does not exist
limx→4f(x)=0
The correct Answer is:A, B, C, D
Step by step video & image solution for The graph of the function y=f(x) is shown in the adjacent figure then correct statement is by Maths experts to help you in doubts & scoring excellent marks in Class 12 exams.
Updated on:21/07/2023Topper's Solved these Questions
- LIMITSBOOK - ARIHANT MATHSCHAPTER - LIMITSEXERCISE - Exercise (Passage Based Questions)
10 Videos
- LIMITSBOOK - ARIHANT MATHSCHAPTER - LIMITSEXERCISE - Exercise (Matching Type Questions)
3 Videos
- LIMITSBOOK - ARIHANT MATHSCHAPTER - LIMITSEXERCISE - Exercise (Single Option Correct Type Questions)
38 Videos
- INVERSE TRIGONOMETRIC FUNCTIONSBOOK - ARIHANT MATHSCHAPTER - INVERSE TRIGONOMETRIC FUNCTIONSEXERCISE - Exercise (Questions Asked In Previous 13 Years Exam)
8 Videos
- LOGARITHM AND THEIR PROPERTIESBOOK - ARIHANT MATHSCHAPTER - LOGARITHM AND THEIR PROPERTIESEXERCISE - Exercise (Questions Asked In Previous 13 Years Exam)
4 Videos
Similar Questions
If limx→af(x)=1 and limx→ag(x)=∞ then limx→a{f(x)}g(x)=elimx→a(f(x)−1)g(x)
limx→0(sinxx)sinxx−sinx is equal to
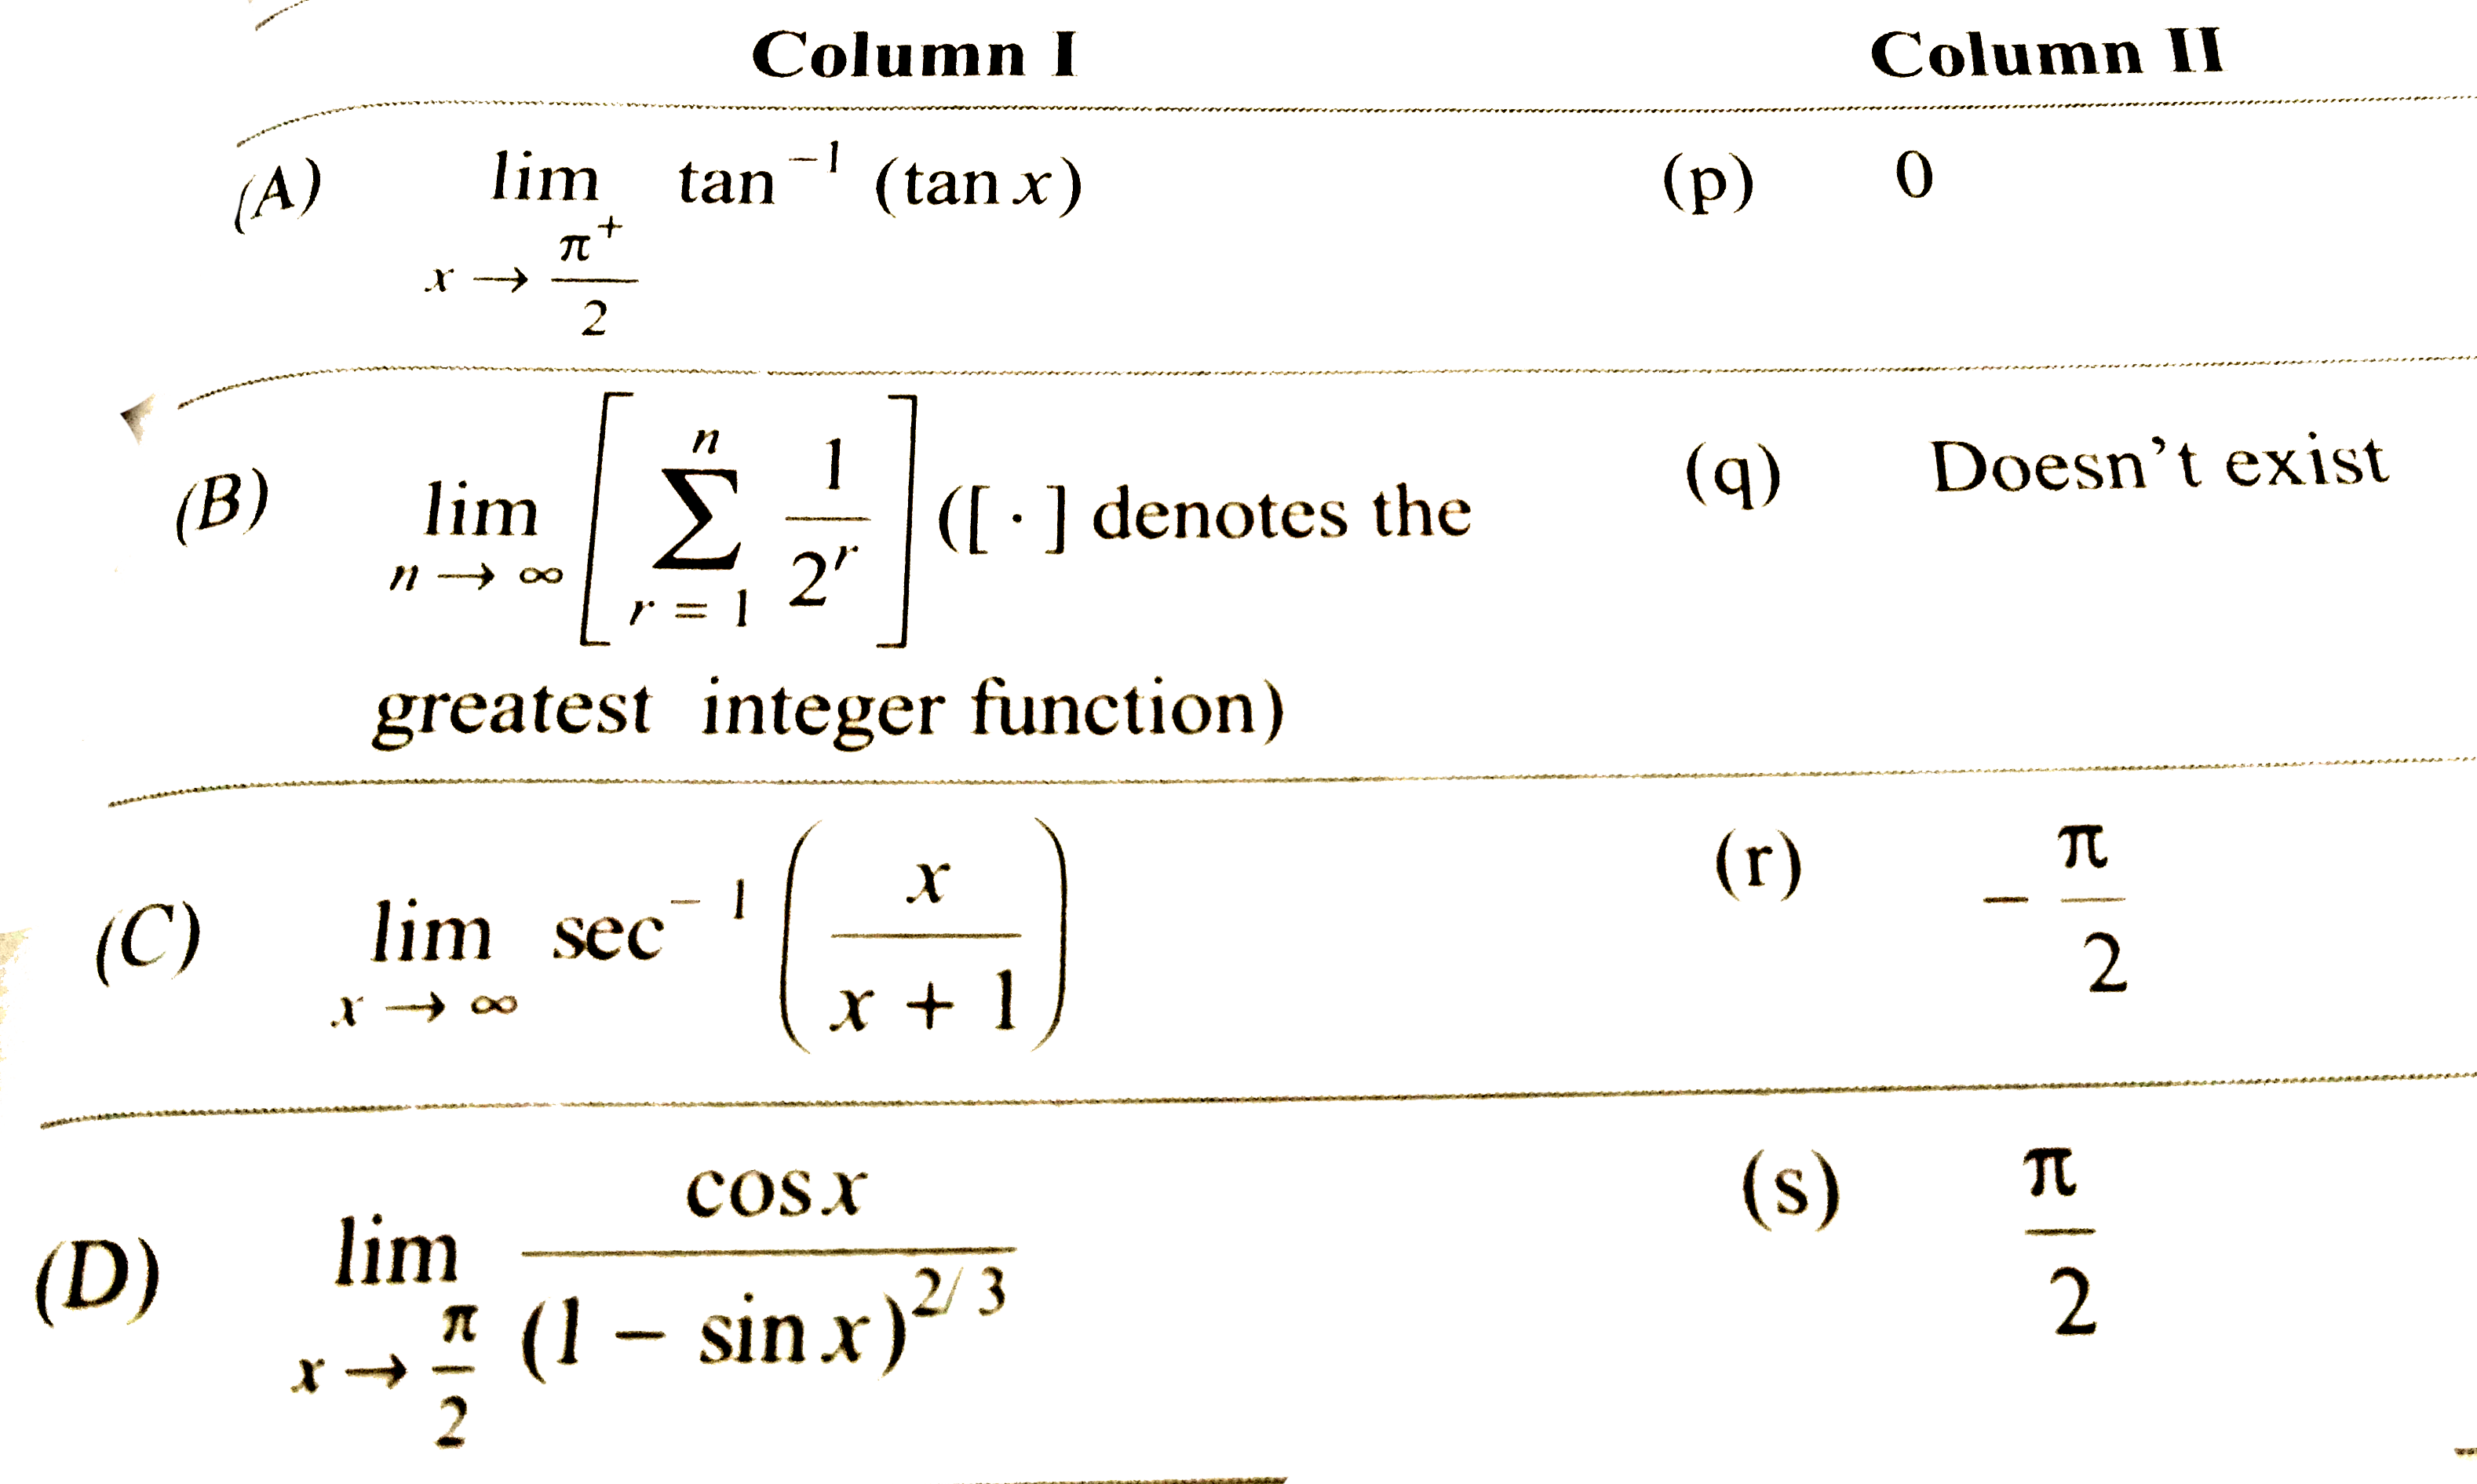
View SolutionMatch the statements of Column I with values of Column II.

View Solutionlimx→0sin(πcos2(tan(sinx)))x2 is equal to
View SolutionIf α=3sin−1(611andβ=3cos−1(49), where the inverse trigonometric functions take only the principal values, then the correct options (s) is (are)
View SolutionIn Which quadrant Point (−2,−3) will be lie.
View SolutionHow many lines of symmetry does the above figure have ?
View SolutionWhich of the following are correct chain isomers of butane ? (i)
View SolutionDetermine the point of symmetry of a regular hexagon.
View SolutionDtermine the images of the following figure about the given line :
View SolutionMatch the following Column A to Column B

View SolutionMatch the following Column A to Column B

View SolutionMatch the following Column A to Column B

View SolutionThe inequation represented by the graph given below is :
View SolutionThe inequation that best describes the graph given below is _________
View SolutionThe inequation that best describes the following graph is _________
View SolutionWhich inequations represent the shaded region in the given figure
View Solution
