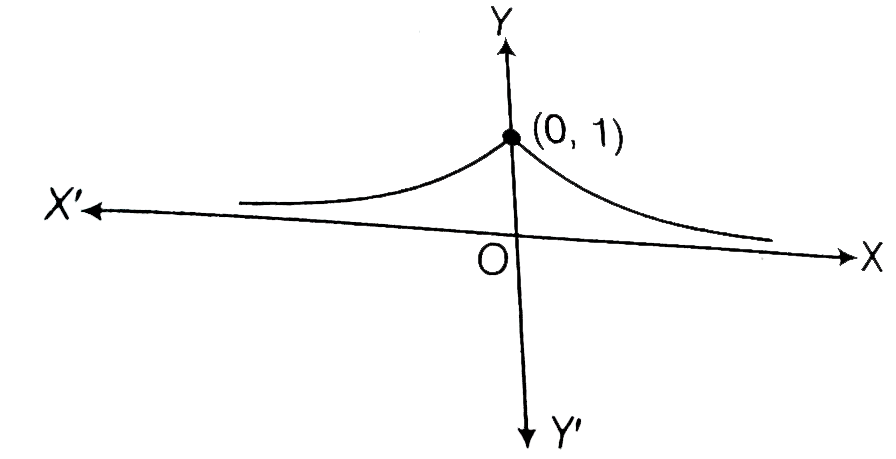
Which one of the following function best represents the graphs as shown below?
 Solution in Punjabi
(a) f(x)=11+x2
(b) f(x)=1√1+|x|
(c) f(x)=e−|x|
(d) f(x)=a|x|,a>1
The correct Answer is:C
Step by step video & image solution for Which one of the following function best represents the graphs as shown below? by Maths experts to help you in doubts & scoring excellent marks in Class 12 exams.
Updated on:21/07/2023Topper's Solved these Questions
- FUNCTIONSBOOK - ARIHANT MATHSCHAPTER - FUNCTIONSEXERCISE - Exercise (More Than One Correct Option Type Questions)
25 Videos
- FUNCTIONSBOOK - ARIHANT MATHSCHAPTER - FUNCTIONSEXERCISE - Exercise (Statement I And Ii Type Questions)
11 Videos
- FUNCTIONSBOOK - ARIHANT MATHSCHAPTER - FUNCTIONSEXERCISE - Exercise For Session 12
4 Videos
- ESSENTIAL MATHEMATICAL TOOLS BOOK - ARIHANT MATHSCHAPTER - ESSENTIAL MATHEMATICAL TOOLS EXERCISE - Exercise (Single Integer Answer Type Questions)
3 Videos
- GRAPHICAL TRANSFORMATIONSBOOK - ARIHANT MATHSCHAPTER - GRAPHICAL TRANSFORMATIONSEXERCISE - Exercise (Questions Asked In Previous 13 Years Exam)
10 Videos
Similar Questions
Which of the following function(s) is/are transcendental?
a. f(x)=5sin(√x)
b. f(x)=2sin3xx2+2x−1
c. f(x)=√x2+2x+1
d. f(x)=(x2+3)⋅2x
View SolutionStatement I The function f(x) =xsinx and f'(x)=xcosx+sinx are both non-periodic.
Statement II The derivative of differentiable functions (non-periodic) is non-periodic function.
View SolutionFor x∈R−{1}, the function f(x ) satisfies f(x)+2f(11−x)=x. Find f(2).
View SolutionThe number of solutions of the equation |x−1|−|2x−5|=2x
View SolutionFind the number of solutions of the equation x21−|x−2|=1, graphically.
View SolutionWhich of the following are correct chain isomers of butane ? (i)
View SolutionDetermine the point of symmetry of a regular hexagon.
View SolutionMatch the following Column A to Column B

View SolutionMatch the following Column A to Column B

View SolutionMatch the following Column A to Column B

View SolutionThe inequation represented by the graph given below is :
View SolutionThe inequation that best describes the graph given below is _________
View SolutionThe inequation that best describes the following graph is _________
View SolutionWhich inequations represent the shaded region in the given figure
View SolutionThe equation of straight line shown in figure is :
ltimg src="https://d10lpgp6xz60nq.cloudfront.net/physics_images/ALN_PHY_R04_E01_020_Q01.png" width="80%"gt
View SolutionWhat is the distance OA for the square shown in figure :- ltimg src="https://d10lpgp6xz60nq.cloudfront.net/physics_images/ALN_PHY_R05_E01_015_Q01.png" width="80%"gt
View Solution
