In plants, the exchange of gases takes place through the stomata. During day time, they take up carbon dioxide and release oxygen for photosynthesis while during night time, the process gets reversed. Which of the following graphs correctly represents the effect of the duration for which stomata remain open on the amonnt of oxygen taken in?
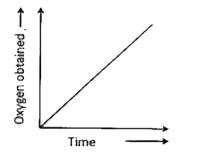
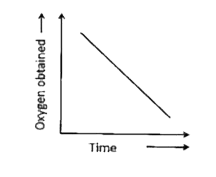
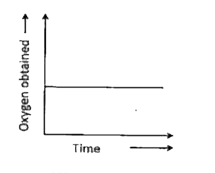
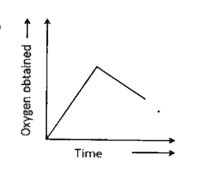
To determine which graph correctly represents the effect of the duration for which stomata remain open on the amount of oxygen taken in by plants, we can follow these steps:
1. Understand the Function of Stomata: Stomata are small openings on the surfaces of leaves that allow for gas exchange. During the day, they take in carbon dioxide and release oxygen through the process of photosynthesis.
2. Recognize the Day-Night Cycle: During the daytime, stomata are open, and photosynthesis occurs, resulting in the production of oxygen. At night, stomata may still be open, but the process reverses; the plant uses oxygen for respiration and releases carbon dioxide.
3. Analyze the Relationship: The amount of oxygen taken in by the plant is directly related to the duration the stomata remain open during the day. The longer the stomata are open, the more oxygen is produced.
4. Graph Behavior During Day and Night:
- Daytime: As time increases, the amount of oxygen taken in increases. This should be represented as a rising line on the graph.
- Nighttime: After a certain point (when it becomes night), the amount of oxygen taken in will start to decrease as the plant uses the oxygen for respiration.
5. Identify the Correct Graph: The correct graph will show an initial increase in oxygen levels as time progresses during the day, followed by a decrease in oxygen levels as time continues into the night.
6. Select the Option: Based on the analysis, the graph that shows an increase in oxygen levels during the day and a subsequent decrease at night is the correct representation. According to the information provided, this corresponds to option number 4.
Final Answer:
The correct graph that represents the effect of the duration for which stomata remain open on the amount of oxygen taken in is Option 4.
- Daytime: As time increases, the amount of oxygen taken in increases. This should be represented as a rising line on the graph.
- Nighttime: After a certain point (when it becomes night), the amount of oxygen taken in will start to decrease as the plant uses the oxygen for respiration.
The correct graph that represents the effect of the duration for which stomata remain open on the amount of oxygen taken in is Option 4.
Topper's Solved these Questions
- LIFE ON EARTHBOOK - BETOPPERSCHAPTER - LIFE ON EARTHEXERCISE - CONCEPTIVE WORKSHEET
14 Videos
- LIFE ON EARTHBOOK - BETOPPERSCHAPTER - LIFE ON EARTHEXERCISE - SUMMATIVE WORKSHEET (MULTIPLE CHOICE QUESTIONS)
5 Videos
- HEALTH AND HYGIENEBOOK - BETOPPERSCHAPTER - HEALTH AND HYGIENEEXERCISE - SUMMATIVE WORKSHEET
34 Videos
- OUR ENVIRONMENTBOOK - BETOPPERSCHAPTER - OUR ENVIRONMENTEXERCISE - SUMMATIVE WORKSHEET (ANSWER THE FOLLOWING QUESTIONS:)
24 Videos
Similar Questions
If a plant is releasing carbon dioxide and taking in oxygen during the day, does it mean that there is no photosynthesis occurring? Justify your answer.
View SolutionIf a plant is releasing carbon dioxide and taking in oxygen during the day, does it mean that there is no photosynthesis occurring? Justify your answer.
View Solution
Knowledge Check
Release of oxygen during photosynthesis takes place in which of the following steps?
APhotophosphorylationBReduction of NADPCCarbon fixationDPhotolysis of waterIn which type of plants, the stomata remain closed during day time and open during night
APhotophilousBSucculentsCSciphilousDhalophytesTwo stones are through up simultaneously from the edge of a cliff 240 m high with initial speed of 10 m/s and 40 m/s respectively. Which of the following graphs best represents the time variation of relative position of the second stone with respect to the first? Assume stones do not rebound after hitting the ground and neglect air resistance, take . g=10m/s2 (The figures are schematic and not drawn to scale)
A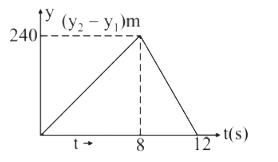 B
B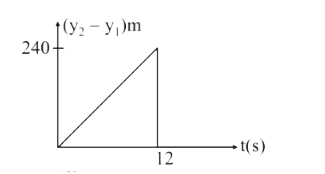 C
C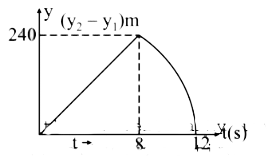 D
D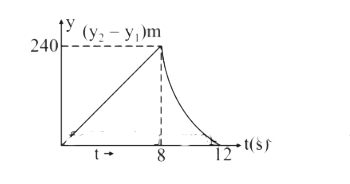
If a plant is releasing carbon dioxide and taking in oxygen during the day, does it mean that there is no photosynthesis occurring ? Justify your answer.
View SolutionPhotosynthesis is the process by which autotrophs take in susbstances from the outside and convert take insubstances from the outside and convert them into stored formes of energy .the materials is taken in the form of carbon dioxide and water which is converted into carbohydrates in the presence of sunlight chlorophyll . The carbohydrates which are not used immediately are stores in the form of starch , which serves as the internal energy reserve to be used as and when required by the plant . The complex substances have to be broken down into simpler ones before they can be used for the unkeep and growth of the body .
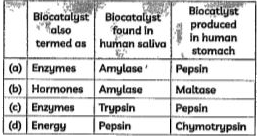
Choose the correct combination of plots provided in the following table .
View SolutionDirections :
In this section you have few short passages. After each passage, you will find some items based on the passage. First, read a passage and answer the items based on it. You are required to select your answers based on the contents of the passage and opinion of the author only.
Passage
In Delhi, it was forbidden by the law, at one time, to take a Dog into a public vehicle. One day a lady, accompanied by a pet dog, entered a bus. Wishing to evade the law, she placed her tiny dog in her dress pocket. It so happened that the person next to this lady was a pick-pocket, and during the journey he carefully placed his hand into her pocket in search of her purse-Great was the horror to find instead a pair of sharp teeth inserted into his fingers. His exclamation of pain and surprise drew the attention of other passengers to him.
Which one of the following correctly expresses the meaning of "wishing to evade the law" ?
View SolutionThe following processes occur during photosynthesis A. reduction of carbon dioxide B. the splitting of water C. the synthesis of glucose D. formation of oxygen gas E. formation of ATP. Which one of the following combinations is correct for the light phase
View SolutionEnergy is needed to maintain a state of order in our body. Some organisms use simple food material obtained from inorganic source and other organisms utilise complex substances. These substances have to be broken down into simpler ones before they can be used for the upkeep and growth of the body.
Which of the following statement(s) is (are) true about stomata?
(I) These are the tiny pores present on the surface of the leaves.
(II) Through these, massive amounts of gaseous exchange take place.
(III) Plants open these pores when carbon dioxide is not required.
(IV) Guard cells operate the opening and closing of these pores.
View Solution
