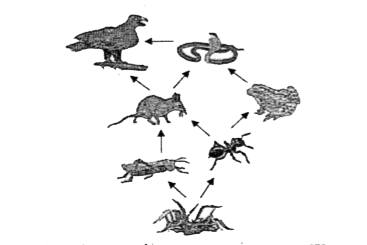
The illustration represents a forest food chain.

If the population of squirrel increases, then which of the following observations will be most probably true?
The population of plants will increase.
The population of the fox will increase.
The population of snake and fox will decrease.
The population of snake and plants will decrease
Step by step video & image solution for The illustration represents a forest food chain. If the population of squirrel increases, then which of the following observations will be most probably true? by Biology experts to help you in doubts & scoring excellent marks in Class 6 exams.
Updated on:21/07/2023Topper's Solved these Questions
- OUR ENVIRONMENTBOOK - BETOPPERSCHAPTER - OUR ENVIRONMENTEXERCISE - SUMMATIVE WORKSHEET (MULTIPLE TYPE QUESTIONS)
6 Videos
- OUR ENVIRONMENTBOOK - BETOPPERSCHAPTER - OUR ENVIRONMENTEXERCISE - SUMMATIVE WORKSHEET (FILL IN THE BLANKS)
11 Videos
- OUR ENVIRONMENTBOOK - BETOPPERSCHAPTER - OUR ENVIRONMENTEXERCISE - SUMMATIVE WORKSHEET (ANSWER THE FOLLOWING QUESTIONS:)
24 Videos
- LIFE ON EARTHBOOK - BETOPPERSCHAPTER - LIFE ON EARTHEXERCISE - SUMMATIVE WORKSHEET
5 Videos
- SOILBOOK - BETOPPERSCHAPTER - SOILEXERCISE - SUMMATIVE WORKSHEET
14 Videos
Similar Questions
The illustration represents a food chain.

If the population of the dragonfly larva increases, then which of the following observations will be most probably true?
View SolutionThe illustration represents a marine food chain.

If the killer whale population increases, then which of the following observations will be most probably true?
View Solution
Knowledge Check
Which of the following food chains is correct?
AGrasses → Fox → RabbitBPhytoplankton → Zooplankton → FishCGrasses → Chameleon → Insects → BirdsDFallen leaves → Bacteria → Insect → BirdsWhich of the following food chain shows spindle
AGrass → Insects → FrogBPhytoplankton → Zooplankton → Small fishCTree → Brids → HawksDTree → Birds → Insects → Bacteria
The illustration represents a marine food chain .

If the penguine population decreses, then which of the following observation will be most probablu true?
View SolutionThe illustration represents a food web.

If the snake population decreases, which of the following observations will be most probably true?
View SolutionThe illustration shows an ocean food web.

If the population of shrimp decreases, then which of the following populations would decrease?
View SolutionThe illustrated food chain operates in a forest.

If most of the rat population died because of a disease, then which of the following observations would be most probably true?
View SolutionIn a forest, the illustrated food chain exists between the plants, insects, frog, snake, and the hawk populations:

If the frog population decreases because of some natural catastrophe, then which of the following recorded observations will be most probably true?
View SolutionThe illustration represents a food chain.

The consumers in the given food chain are labeled as
View Solution
