The diagram shows a number line.

The value of x + y is
-32
-8
8
32
Step by step video & image solution for The diagram shows a number line. The value of x + y is by Maths experts to help you in doubts & scoring excellent marks in Class 6 exams.
Updated on:21/07/2023Topper's Solved these Questions
Similar Questions
Knowledge Check
The diagram shows the electric field lines produced by an electrostalic focusing device.
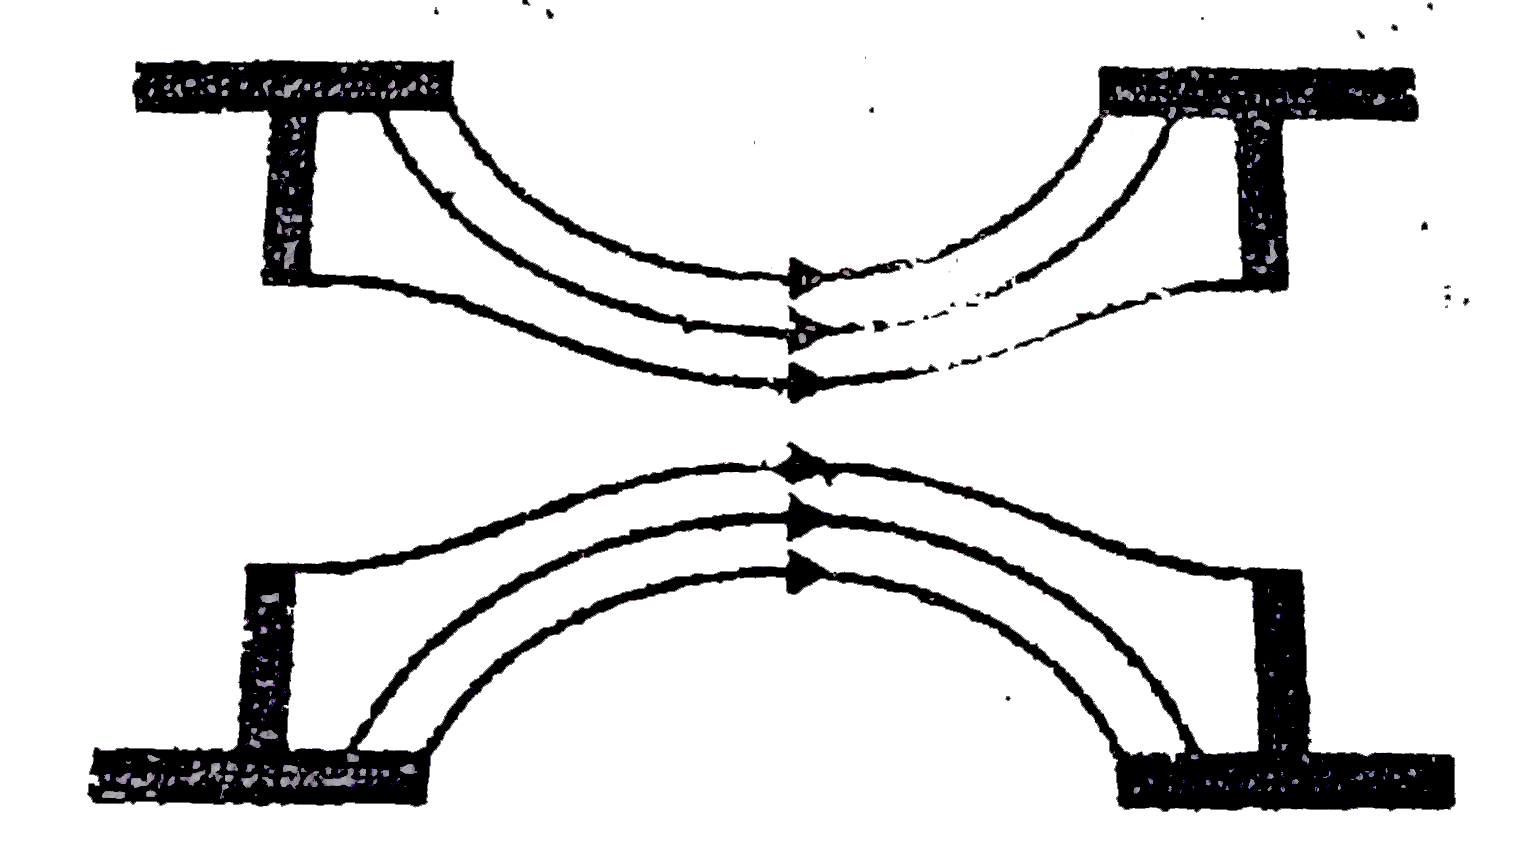
Which one of the following diagrams best shows the corresponding equipotential lines? The electric field are shown as broken lines on each of the diagrams.A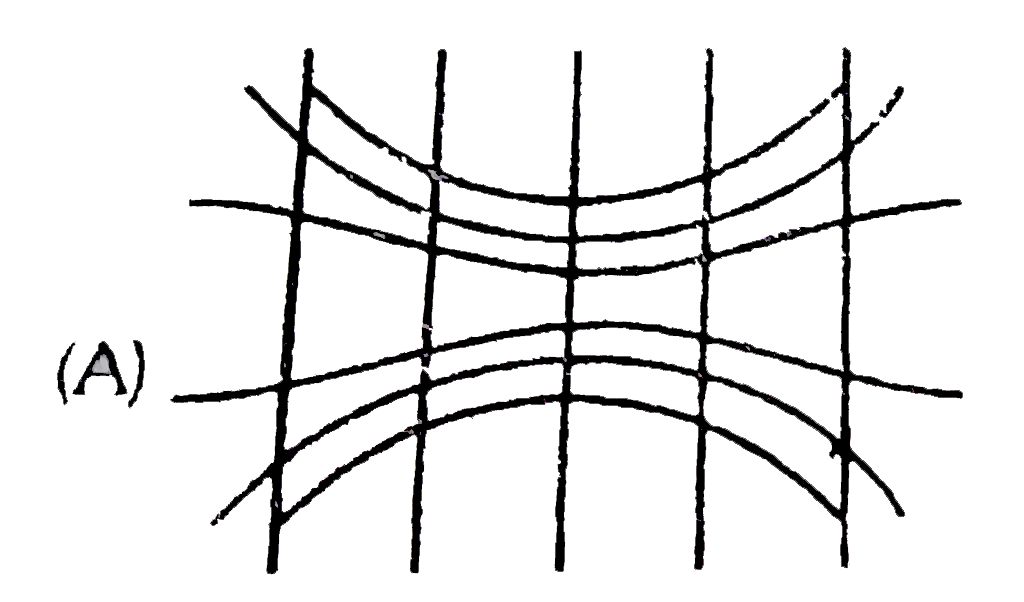 B
B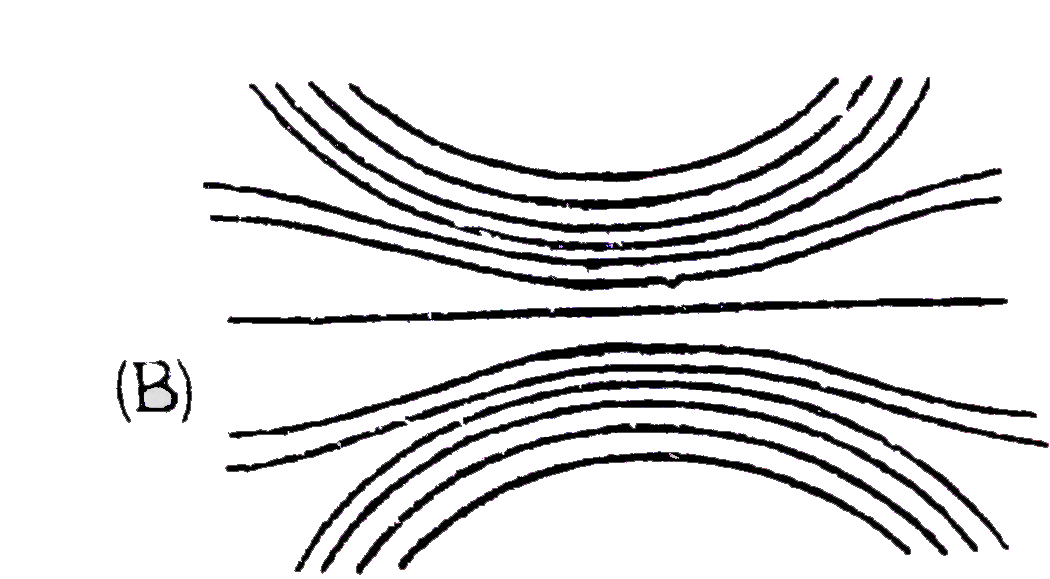 C
C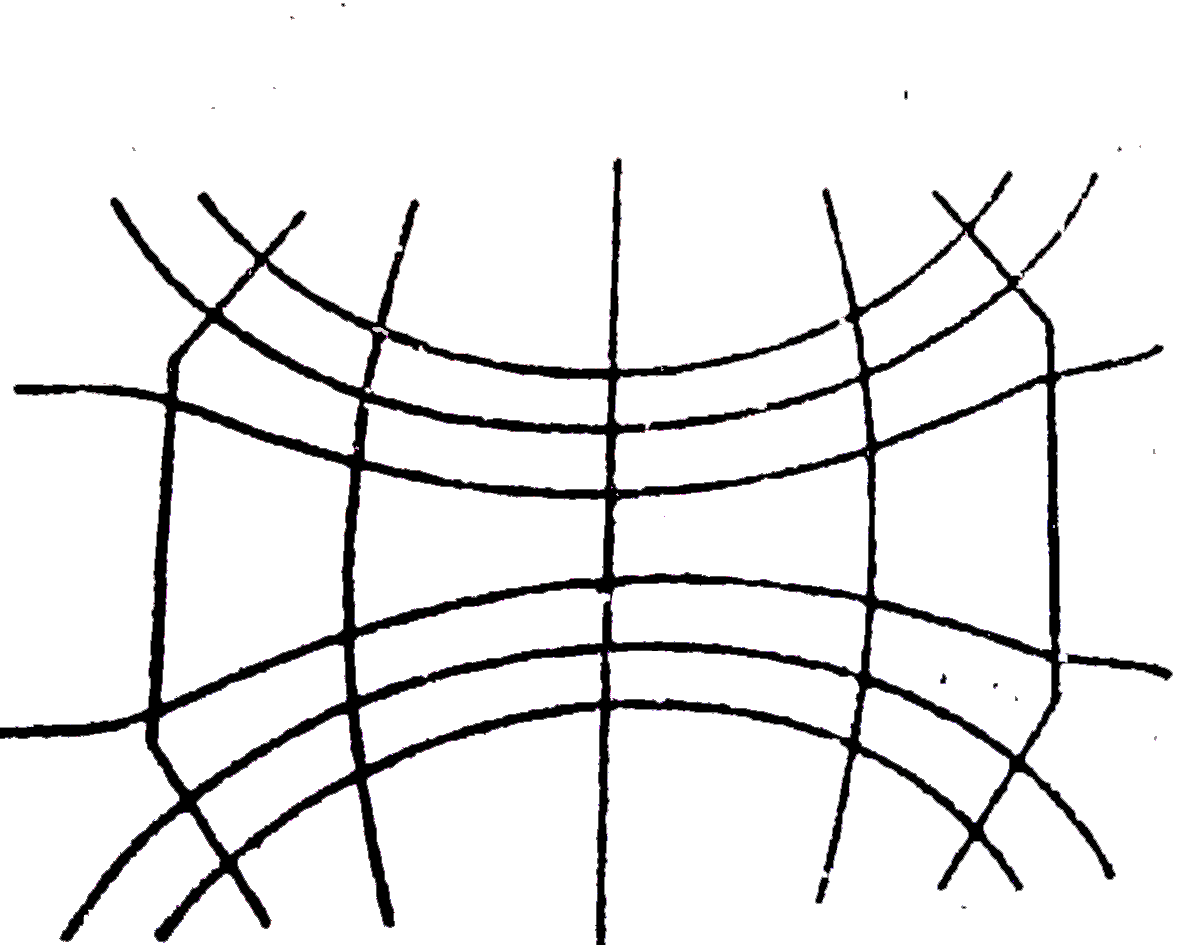 D
D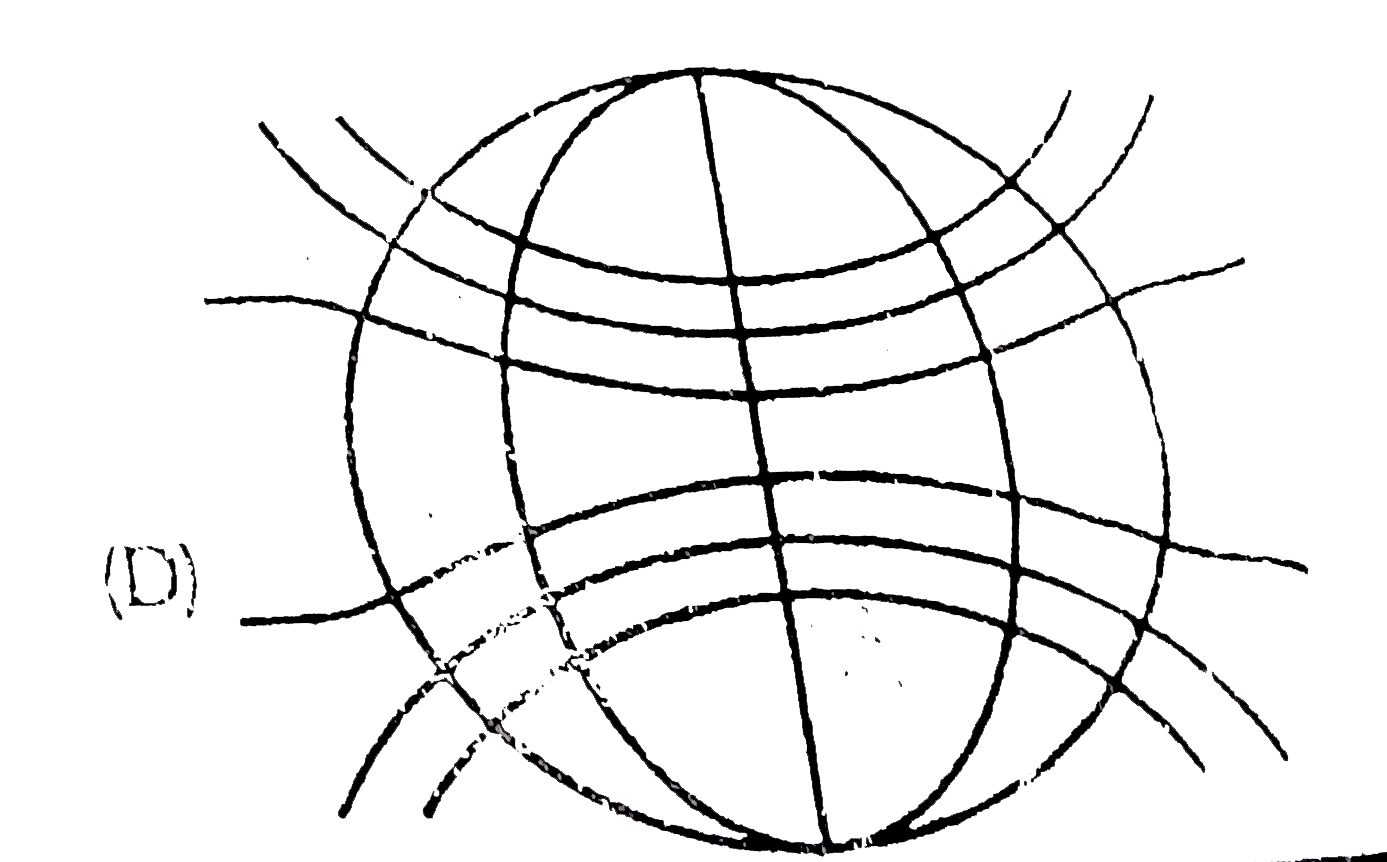
The line graph shows the number of vacancies for sales officers in a certain company. Study the diagram and answer the following questions.
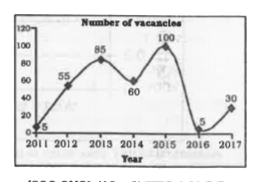
In which year was the number of vacancies less than that of the previous year?A116.70%B50%C200%D100%The absolute value of a number is its distance from 0 on a number line. The number line representing the inequaltiy |x|<4 is
A B
B C
C D
D
Draw the diagram to show the area enclosed by the curves :
y2=16xandx2=16y.
The straight line x=4 divides the area into two parts. Find the area of the larger portion by integration.
View SolutionUse the information given in the followines diagram to find the values of x,yandz.
View SolutionIf the tangent to a curve y =x3−x at x =2 is parallel to the line y = mx -19 then the value of m is
View SolutionThe line graph shows the number of vacancies for executives in a certain company. Study the diagram and answer the following questions.
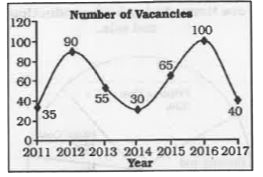
The number of vacancies in 2014 was lesser than that in 2016 by ___.
View SolutionThe line graph shows the number of vacancies for executives in a certain company. Study the diagram and answer the following questions.

The number of vacancies in 2014 was lesser than that in 2016 by ___.
View Solution
