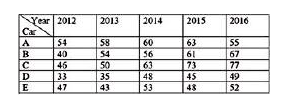
The average production of type C cars during 2012 to 2016 is approximately what percent less than the total production of type D cars in 2012 and type E cars in 2014?
0.464
0.492
0.486
0.428
The correct Answer is:A
To solve the problem step by step, we will follow these instructions:
Step 1: Calculate the total production of type C cars from 2012 to 2016.
We need to find the average production of type C cars during the years 2012 to 2016. The production numbers for type C cars are as follows:
- 2012: 44
- 2013: 45
- 2014: 67
- 2015: 63
- 2016: 76
First, we calculate the total production:
Total Production = 44 + 45 + 67 + 63 + 76 = 295
Step 2: Calculate the average production of type C cars.
To find the average, we divide the total production by the number of years (5):
Average Production of Type C = Total Production / Number of Years = 295 / 5 = 59
Step 3: Find the production of type D cars in 2012.
From the data, the production of type D cars in 2012 is given as:
Production of Type D in 2012 = 46
Step 4: Find the production of type E cars in 2014.
From the data, the production of type E cars in 2014 is given as:
Production of Type E in 2014 = 64
Step 5: Calculate the total production of type D cars in 2012 and type E cars in 2014.
Total Production = Production of Type D in 2012 + Production of Type E in 2014
Total Production = 46 + 64 = 110
Step 6: Calculate the percentage less of the average production of type C cars compared to the total production of type D and E cars.
We need to find what percent less the average production of type C cars (59) is compared to the total production (110):
Percentage Less = ((Total Production - Average Production) / Total Production) × 100
Percentage Less = ((110 - 59) / 110) × 100
Percentage Less = (51 / 110) × 100 ≈ 46.36%
Step 7: Convert the percentage to decimal form.
To express this as a decimal, we divide by 100:
Decimal Form = 46.36 / 100 = 0.4636
Step 8: Round the answer to three decimal places.
Rounding 0.4636 gives us approximately 0.464.
Final Answer:
The average production of type C cars during 2012 to 2016 is approximately 0.464 percent less than the total production of type D cars in 2012 and type E cars in 2014.
---
We need to find the average production of type C cars during the years 2012 to 2016. The production numbers for type C cars are as follows:
- 2012: 44
- 2013: 45
- 2014: 67
- 2015: 63
- 2016: 76
Total Production = 44 + 45 + 67 + 63 + 76 = 295
To find the average, we divide the total production by the number of years (5):
Average Production of Type C = Total Production / Number of Years = 295 / 5 = 59
From the data, the production of type D cars in 2012 is given as:
Production of Type D in 2012 = 46
From the data, the production of type E cars in 2014 is given as:
Production of Type E in 2014 = 64
Total Production = Production of Type D in 2012 + Production of Type E in 2014
Total Production = 46 + 64 = 110
We need to find what percent less the average production of type C cars (59) is compared to the total production (110):
Percentage Less = ((Total Production - Average Production) / Total Production) × 100
Percentage Less = ((110 - 59) / 110) × 100
Percentage Less = (51 / 110) × 100 ≈ 46.36%
To express this as a decimal, we divide by 100:
Decimal Form = 46.36 / 100 = 0.4636
Rounding 0.4636 gives us approximately 0.464.
The average production of type C cars during 2012 to 2016 is approximately 0.464 percent less than the total production of type D cars in 2012 and type E cars in 2014.
Topper's Solved these Questions
Similar Questions
The table shows the production of different types of cars (in thousands).
यह तालिका एक कंपनी द्वारा अलग-अलग कारों के उत्पादन (हज़ार में ) को दर्शाती है |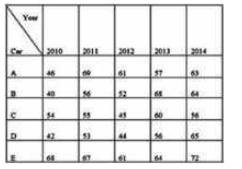 The average production of all type of cars in 2014 is approximately what percent less than the total production of type B cars in 2013 and type D cars in
2010 taken together?
2014 में सभी प्रकार की कारों का औसत उत्पादन 2013 में B प्रकार तथा 2010 में D प्रकार की कारों के कुल उत्पादन से लगभग कितना प्रतिशत कम है ?
View SolutionThe table shows the production of different types of cars (in thousands).
यह तालिका एक कंपनी द्वारा अलग-अलग कारों के उत्पादन ( हज़ार में ) को दर्शाती है |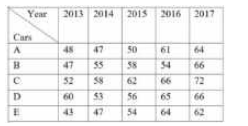 The total production of type B cars during 2013 to 2016 is approximately what percent less than the total production of cars in 2017?
2013 से 2016 के दौरान B प्रकार की कारों का कुल उत्पादन 2017 में कारों के कुल उत्पादन से लगभग कितना प्रतिशत कम है ?
View Solution
Knowledge Check
The table shows the production of different types of cars (in thousands).
यह तालिका एक कंपनी द्वारा अलग-अलग कारों के उत्पादन (हज़ार में ) को दर्शाती है | The average production of all type of cars in 2014 is approximately what percent less than the total production of type B cars in 2013 and type D cars in
2010 taken together?
2014 में सभी प्रकार की कारों का औसत उत्पादन 2013 में B प्रकार तथा 2010 में D प्रकार की कारों के कुल उत्पादन से लगभग कितना प्रतिशत कम है ?A0.418B0.449C0.432D0.444The table shows the production of different types of cars ( in thousands).

The average production of cars in 2018 is approximately what percent less than the total production of type D cars in 2015 and type B cars in 2017 taken together ?A45.8%B43.6%C42.4%D44.2%The table shows the production of different types of cars
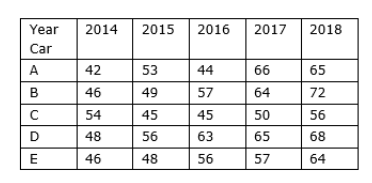
The average production of cars in 2018 is approximately what percent less than the total production of type D cars in 2015 and type b cars in 2017 taken together?A0.458B0.436C0.424D0.442
The table shows the production of different types of cars (in thousands).
यह तालिका अलग-अलग प्रकार के कारों का उत्पादन ( हज़ार में) दर्शाती है | The total production of type B cars in 2012, 2014 and 2015 taken together is approximately what percent more than the total production of type A cars in 2013 and 2016 taken together?
2012, 2014 और 2015 में B प्रकार की कारों का कुल उत्पादन 2013 एवं 2016 में A प्रकार की कारों के कुल उत्पादन से लगभग कितना प्रतिशत अधिक है ?
View SolutionThe table shows the production of different types of cars (in thousands).
यह तालिका एक कंपनी द्वारा अलग-अलग कारों के उत्पादन ( हज़ार में ) को दर्शाती है | The total production of type B cars during 2013 to 2016 is approximately what percent less than the total production of cars in 2017?
2013 से 2016 के दौरान B प्रकार की कारों का कुल उत्पादन 2017 में कारों के कुल उत्पादन से लगभग कितना प्रतिशत कम है ?
View SolutionThe table shows the production of different types of cars (in thousands).
The total production of types E cars in 2012 and 2013 is approximately what percent more than the average production of type A cars during the years 2012 to 2016?
View SolutionThe table shows the production of different types of cars (in thousands).
यह तालिका एक कंपनी द्वारा अलग-अलग कारों के उत्पादन ( हज़ार में ) को दर्शाती है |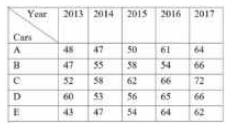 The total production of type B cars in 2015 and type C cars in 2013 is what percent more than the total production of type E cars in 2013 and 2014 ? (Correct to one decimal place)
2015 में B प्रकार तथा 2013 में प्रकार की कारों का कुल उत्पादन 2013 तथा 2014 में E प्रकार की कारों के कुल उत्पादन से कितना प्रतिशत अधिक है ? (एक दशमलव स्थान तक)
View SolutionThe total production of type B cars in 2015 and type D cars 2016 is what percent less than the total production of type E cars in five years?

View Solution