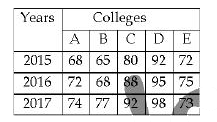
This table shows the percentage of students passing out of five different colleges over three years. It is given that from each college, 200 students appeared every year.
यह तालिका तीन वर्षों में पांच अलग-अलग कॉलेजों से पास करने वाले छात्रों का प्रतिशत दर्शाती है | यह दिया गया है कि प्रत्येक कॉलेज से हर वर्ष 200 छात्र शामिल हुए |
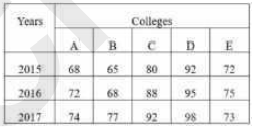 In which college the average percentage of passing students over the given three years is the
least?
किस कॉलेज में दिए गए तीन वर्षों के दौरान पास करने वाले छात्रों का औसत प्रतिशत सबसे कम रहा है ?
E
B
F
A
The correct Answer is:B
Step by step video, text & image solution for This table shows the percentage of students passing out of five different colleges over three years. It is given that from each college, 200 students appeared every year. यह तालिका तीन वर्षों में पांच अलग-अलग कॉलेजों से पास करने वाले छात्रों का प्रतिशत दर्शाती है | यह दिया गया है कि प्रत्येक कॉलेज से हर वर्ष 200 छात्र शामिल हुए | In which college the average percentage of passing students over the given three years is the least? किस कॉलेज में दिए गए तीन वर्षों के दौरान पास करने वाले छात्रों का औसत प्रतिशत सबसे कम रहा है ? by Maths experts to help you in doubts & scoring excellent marks in Class 14 exams.
Topper's Solved these Questions
Similar Questions
This table shows the percentage of students passing out of five different colleges over three years. It is given that from each college, 200 students appeared every year.
यह तालिका तीन वर्षों में पांच अलग-अलग कॉलेजों से पास करने वाले छात्रों का प्रतिशत दर्शाती है | यह दिया गया है कि प्रत्येक कॉलेज से हर वर्ष 200 छात्र शामिल हुए |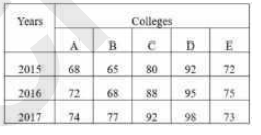 What is the approximate percentage increase in the number of students passing out of college B in the year 2017 as compared to the previous year?
कॉलेज B से वर्ष 2017 में पास करने वाले छात्रों की संख्या में पिछले वर्ष की तुलना में लगभग कितने प्रतिशत की वृद्धि हुई है ?View SolutionThis table shows the percentage of students passing out of five different colleges over three years. It is given that from each college, 200 students appeared every year.
यह तालिका तीन वर्षों में पांच अलग-अलग कॉलेजों से पास करने वाले छात्रों का प्रतिशत दर्शाती है | यह दिया गया है कि प्रत्येक कॉलेज से हर वर्ष 200 छात्र शामिल हुए |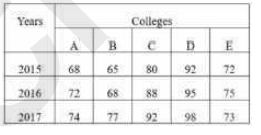 What is the ratio of the number of students passing to those failing from college E in the year 2015?
वर्ष 2015 में कॉलेज E से पास करने वाले छात्रों की संख्या का फेल करने वाले छात्रों की संख्या के साथ अनुपात ज्ञात करें |View Solution
Knowledge Check
- Question 1 - Select One
This table shows the percentage of students passing out of five different colleges over three years. It is given that from each college, 200 students appeared every year.
यह तालिका तीन वर्षों में पांच अलग-अलग कॉलेजों से पास करने वाले छात्रों का प्रतिशत दर्शाती है | यह दिया गया है कि प्रत्येक कॉलेज से हर वर्ष 200 छात्र शामिल हुए | In which college the average percentage of passing students over the given three years is the
least?
किस कॉलेज में दिए गए तीन वर्षों के दौरान पास करने वाले छात्रों का औसत प्रतिशत सबसे कम रहा है ?AEBBCFDA - Question 2 - Select One
This table shows the percentage of students passing out of five different colleges over three years . It is given that from each college , 200 students appeared every year.
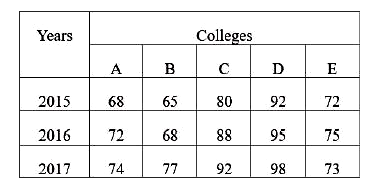
In which college the average percentage of passing students over the given three years is the least?AEBBCADF - Question 3 - Select One
This table shows the percentage of students passing out of five different colleges over three years. It is given that from each college, 200 students appeared every year.
What is the approximate percentage increase in the number of students passing out of college B in the year 2017 as compared to the previous year?A0.132B0.134C0.128D0.13
This table shows the percentage of students passing out of five different colleges over three years. It is given that from each college, 200 students appeared every year.
यह तालिका तीन वर्षों में पांच अलग-अलग कॉलेजों से पास करने वाले छात्रों का प्रतिशत दर्शाती है | यह दिया गया है कि प्रत्येक कॉलेज से हर वर्ष 200 छात्र शामिल हुए |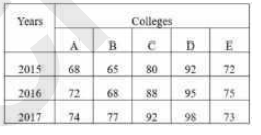
If the number of passed out students of all five colleges is represented by a pie chart, what is the central angle (to nearest whole number) of the sector representing the passed out students of college C?
यदि सभी पांच कॉलेजों से पास करने वाले छात्रों की संख्या को एक पाई-चार्ट में प्रस्तुत किया जाए , तो कॉलेज C से पास कर चुके छात्रों को दर्शाने वाले त्रिज्यखंड का केंद्रीय कोण ( निकटतम पूर्ण संख्या में ) क्या होगा ?View SolutionThe table below shows the number of students enrolled in five colleges over the five years
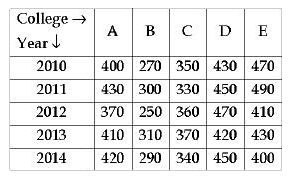
What is the average number of students studying in college D over the given years?View SolutionThe table given below shows the number of students enrolled in different courses of different colleges.
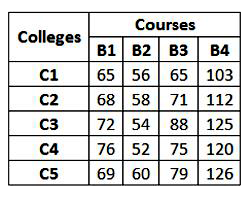
Which college has the highest average number of students per course?View SolutionThe table given below shows the number of students studying in five colleges in the given five years.
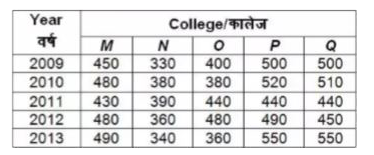
In which of the given years the average number of students studying is maximum?View SolutionThe table given below shows the number of students strudying in five colleges in the given five years.
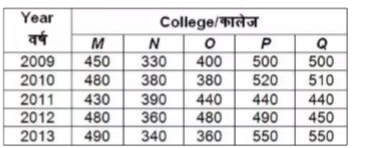
What is the average of the total number of students studying in college M in the given years?View Solution

