What is the average of export during the five financial years?
1279.6
1279.5
1552.4
1025.9
The correct Answer is:A
To find the average of exports during the five financial years, we will follow these steps:
Step 1: List the export values for each financial year.
From the transcript, the export values for the years are:
- 2013-2014: 638
- 2014-2015: 1256
- 2015-2016: 1661
- 2016-2017: 1538
- 2017-2018: 1305
Step 2: Add all the export values together.
Now we will add these values:
638+1256+1661+1538+1305
Calculating step by step:
- First, add the first two values:
638+1256=1894
- Next, add the result to the third value:
1894+1661=3555
- Then, add the fourth value:
3555+1538=4093
- Finally, add the last value:
4093+1305=4398
So, the total export over the five years is 4398.
Step 3: Divide the total export by the number of years to find the average.
To find the average, we divide the total export by the number of years (which is 5):
Average=43985
Calculating the division:
- 4398 divided by 5 gives:
4398÷5=879.6
Final Answer
The average of export during the five financial years is 879.6.
---
From the transcript, the export values for the years are:
- 2013-2014: 638
- 2014-2015: 1256
- 2015-2016: 1661
- 2016-2017: 1538
- 2017-2018: 1305
Now we will add these values:
638+1256+1661+1538+1305
- First, add the first two values:
638+1256=1894
- Next, add the result to the third value:
1894+1661=3555
- Then, add the fourth value:
3555+1538=4093
- Finally, add the last value:
4093+1305=4398
To find the average, we divide the total export by the number of years (which is 5):
Average=43985
- 4398 divided by 5 gives:
4398÷5=879.6
The average of export during the five financial years is 879.6.
Topper's Solved these Questions
Similar Questions
The given Bar Graph presents the Imports and Exports of an item (in tonnes) manufactured by a company for the five financial years, 2013-2014 to 2017-2018.
दिया गया दंड आरेख (बार ग्राफ) 5 वित्त वर्षों, 2013-2014 से 2011-2018 के दौरान एक कंपनी द्वारा निर्मित किसी वस्तु (टन में) के आयात और निर्यात को दर्शाता है |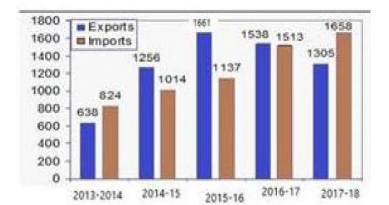 What is the average of Export (in tonnes) during the five financial years?
5 वित्त वर्षों के दौरान निर्यात (टन में] का औसत कितना है?View SolutionThe given Bar Graph presents the Imports and Exports of an item (in tonnes) manufactured by a company for the five financial years, 2013-2014 to 2017-2018.
दिया गया दंड आरेख पांच वित्तीय वर्षो अर्थत 2013-2014 से 2017-2018 तक एक कंपनी के द्वारा निर्मित किसी वस्तु के आयात और निर्यात ( टन में ) को दर्शाता है |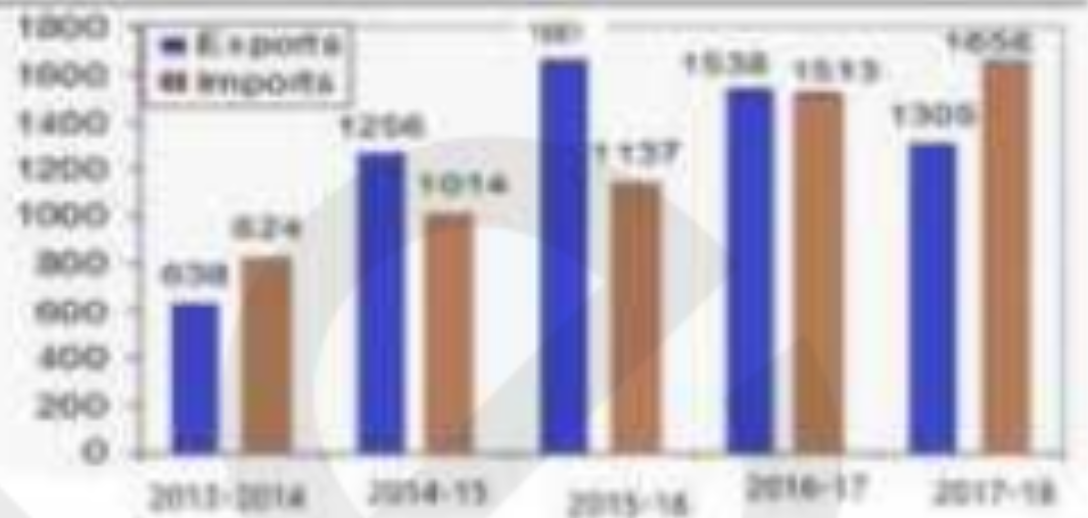 What is the average of Exports (in tonnes) during the five financial years?
पांच वित्तीय वर्षों के दौरान निर्यात (टन ) का औसत कया रहा है ?View Solution
Knowledge Check
- Question 1 - Select One
The given bar graph presents the Imports and Exports of an item manufactured by a company for the give financial years, 2013-2014 to 2017 -2018.
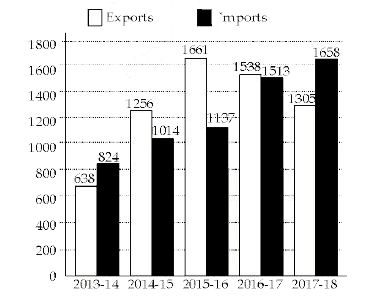
What is the average of imports during the five financila years?A1229.5B1552.4C1229.2D1335.9 - Question 2 - Select One
The given bar graph presents the Imports and Exports of an Item (in tonnes) manufactured by a company for the five financial years, 2013-2014 to 2017-2018.

What is the average of Import (in tonnes) during the five financial years?A1229.5B1552.4C1229.2D1335.9 - Question 3 - Select One
The given bar graph presents the imports and Exports of an item manufactured by a company for the give financial years, 2013-2014 to 2017 -2018.
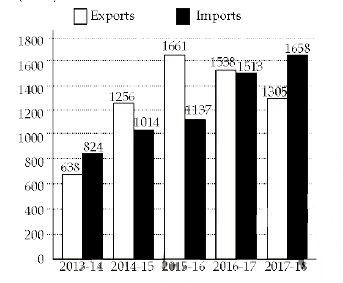
What is the of total imports to total exports during the five financial years?A3199:3073B4175:4011C3073:3199D4011:4175
The given Bar Graph presents the Imports and Exports of an items (in tonnes) manufactured by a company for the five financial Years, 2013-2014 to 2017-2018.
दिया गया दंड आरेख (बार ग्राफ) 5 वित्त वर्षों, 2013-2014 से 2011-2018, के दौरान किसी कंपनी द्वारा निर्मित किसी वस्तु के आयात और निर्यात (टन में) को दर्शाता है|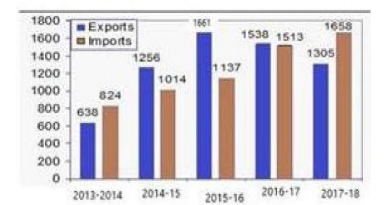 What is the average of Import (in tonnes) during the five financial Years?
5 वित्तीय वर्ष के दौरान आयात का औसत (टन में) क्या है?View SolutionThe given Bar Graph presents the Imports and Exports of an item (in tonnes) manufactured by a company for the five financial years, 2013-2014 to 2017-2018.
दिया गया दंड आरेख (बार ग्राफ) 5 वित्त वर्षों, 2013-2014 से 2011-2018 के दौरान एक कंपनी द्वारा निर्मित किसी वस्तु (टन में) के आयात और निर्यात को दर्शाता है |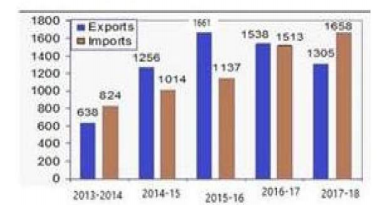 What is the ratio of total Imports to total Exports during the five financial years?
पांचों वित्त वर्षों के दौरान कुल आयात और कुल निर्यात का अनुपात क्या है?View SolutionThe given bar graph presents the Imports and Exports of an item manufactured by a company for the five financial years, 2013-2014 to 2017-2018.
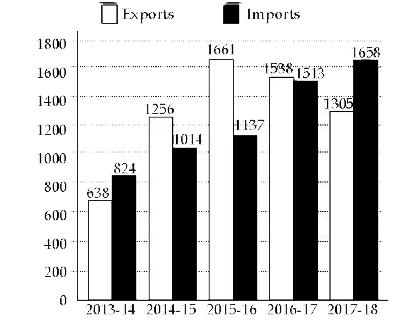
What is the average of total import and Export during the five financial year?View SolutionWhat is the ratio of total exports to total Imports during the five financial years?
View SolutionThe given bar graph presents the Imports and Exports of an item manufactured by a company for the five financial years, 2013-2014 to 2017-2018.

What is the average of absolute difference between exports and Imports during the five financial years?View Solution

