The given bar graph present the sale of a particular brand of tea by three outlets A,B and C during the months Jan, feb , mar and Apr 2018.
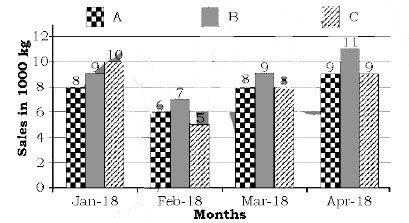
What is the average sale per month by A during jan-mar 2018?
7333.33kg
7505
7334.67
5500
The correct Answer is:A
Step by step video, text & image solution for The given bar graph present the sale of a particular brand of tea by three outlets A,B and C during the months Jan, feb , mar and Apr 2018. What is the average sale per month by A during jan-mar 2018? by Maths experts to help you in doubts & scoring excellent marks in Class 14 exams.
Topper's Solved these Questions
Similar Questions
The given bar graph present the sale of a particular brand of tea by three outlets A,B and C during the months Jan, feb , mar and Apr 2018.

What is the ratio rate of growth in sales from B to the rate of growth in sales from C in mar 2018 with reference to its previous month ?View SolutionThe given bar graph presents the sales of a particular brand of car by three showrooms, A,B and C during the months Jan,Feb ,Mar and Apr 2016
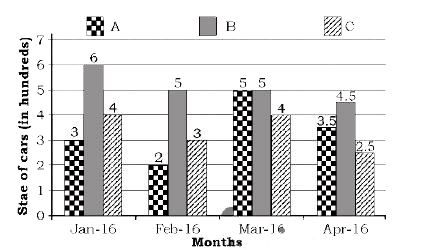
If the cars sold by A and B are all found to be in perfect order, but the cars sold by C were found to be defective to the extent of 15%,10% and 8% and 6% respectively in Jan,Mar and Apr 2016 What is the percentage of defective cars sold by all showrooms during Apr 2016?View Solution
Knowledge Check
- Question 1 - Select One
The given Bar Graph presents the sale (in 1000 kg ) of a particular brand of tea by three outlets, A,B, and C during the months Jan,Feb ,Mar and Apr,2018.
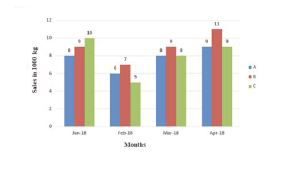
What is average sales per month by A during Jan-Mar,2018?A7505 kgB7333.33 kgC7334.67 kgD5500 kg - Question 2 - Select One
The given Bar Graph presents the sale (in 1000 kg) of a particular brand of ten by three outlets , A,B and C during the months Jan,Feb,Mar and Apr,2018
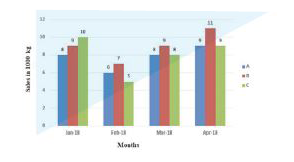
Arrange the ratio of sales from B to that from A and C, taken together,month wise in ascending order.AJan,Feb,Mar,AprBJan,Apr,Mar,FebCJan,Mar,Apr,FebDJan,Mar,Feb,Apr
The given Bar Graph presents the sale of a particular brand of car by three showrooms, A, B and C (in multiples of 100) during the months Jan, Feb, Mar and Apr, 2016.
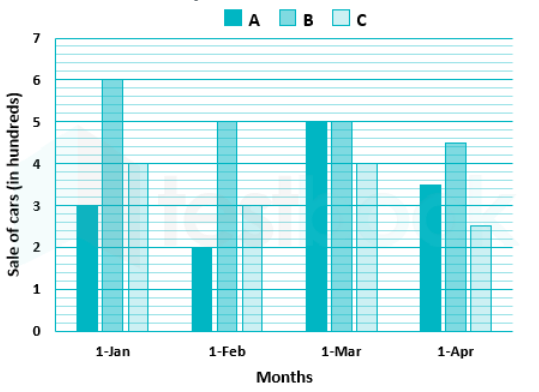
What is the ratio of number of cars sold by A in Jan-Feb, 2016 to that of cars sold by B during Mar-Apr, 2016?View SolutionThe given Bar Graph presents the sale (in 1000kg) of a particular brand of tea by three outlets, A, B and C during the months of Jan, Feb, Mar and Apr, 2018.
दिया गया दंड आरेख (बार ग्राफ) तीन विक्रय केंद्रों A, B और C के दवारा चाय के किसी खास ब्रांड की जनवरी , फरवरी ,मार्च और अप्रैल ,2018 के दौरान (1000 kg में ) बिक्री को दर्शाता है |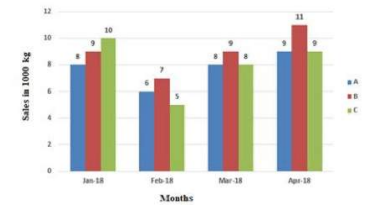 What is the ratio of the rate of growth in sales from B to the rate of growth in sales from C in Mar 2018 with reference to its previous month?
पिछले महीने की तुलना में ,मार्च 2018 में B की बिक्री वृद्धि-दर तथा C की बिक्री वृद्धि-दर का क्या अनुपात है ?View SolutionThe given Bar Graph presents the sale (in 1000kg) of a particular brand of tea by three outlets, A, B and C during the months of Jan, Feb, Mar and Apr, 2018.
दिया गया दंड आरेख (बार ग्राफ) तीन विक्रय केंद्रों A, B और C के दवारा चाय के किसी खास ब्रांड की जनवरी , फरवरी ,मार्च और अप्रैल ,2018 के दौरान (1000 kg में ) बिक्री को दर्शाता है |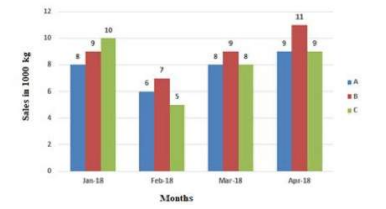 By how much quantity is the average sale per month from B more or less than that from C?
B की प्रति माह औसत बिक्री की मात्रा, C की तुलना में कितना अधिक अथवा कम है?View SolutionThe given Bar Graph presents the sale (in 1000 kg) of a particular brand of tea by three outlets. A, B and C during the months feb, Mar and Apr,2018
दिया गया दंड आरेख तीन आउटलेट A, B और C के द्वारा तीन महीनों : फरवरी, मार्च और अप्रैल 2018 में एक विशेष ब्रांड की चाय की बिक्री ( हज़ार किलो ग्राम में ) को दर्शाता है | What is the average sale per1 month by A during Jan-Mar, 2018?
जनवरी से मार्च 2018 तक A की प्रतिमाह औसत बिक्री कितनी रही है ?View SolutionThe given Bar Graph presents the sale (in 1000 kg) of a particular brand of tea by three outlets. A, B and C during the months feb, Mar and Apr,2018
दिया गया दंड आरेख तीन आउटलेट A, B और C के द्वारा तीन महीनों : फरवरी, मार्च और अप्रैल 2018 में एक विशेष ब्रांड की चाय की बिक्री ( हज़ार किलो ग्राम में ) को दर्शाता है | What is the ratio of rate of growth in sales from B to the rate of growth in sales from C in Mar 2018 with reference to its previous month?
पिछले माह की तुलना में मार्च 2018 में B की बिक्री में वृद्धि का C की बिक्री में वृद्धि के साथ अनुपात ज्ञात करें |View SolutionThe given Bar Graph presents the sale (in 1000 kg) of a particular brand of tea by three outlets. A, B and C during the months feb, Mar and Apr,2018
दिया गया दंड आरेख तीन आउटलेट A, B और C के द्वारा तीन महीनों : फरवरी, मार्च और अप्रैल 2018 में एक विशेष ब्रांड की चाय की बिक्री ( हज़ार किलो ग्राम में ) को दर्शाता है |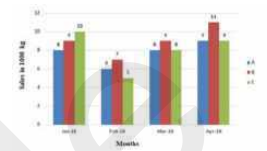 By how much
 quantity is the average sale per month from B more or less than that from C?
By how much
By how much quantity is the average sale per month from B more or less than that from C?
B की प्रतिमाह औसत बिक्री C की प्रतिमाह औसत बिक्री से कितनी अधिक या कम है ?View Solution

