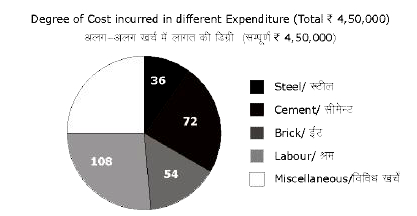
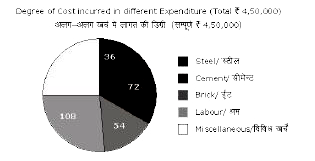
In the given pie chart what is the total expenditure (in percent) on labour charges ?
25%
20%
18%
30%
The correct Answer is:D
Step by step video & image solution for In the given pie chart what is the total expenditure (in percent) on labour charges ? by Maths experts to help you in doubts & scoring excellent marks in Class 14 exams.
Updated on:21/07/2023Topper's Solved these Questions
Similar Questions
Knowledge Check
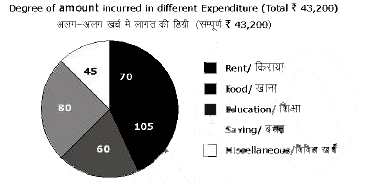
Read the following pie-chart carefully and andswer the question.
Degree of amount incurred in different Expenditure Total Expenditure = Rs. 43,200
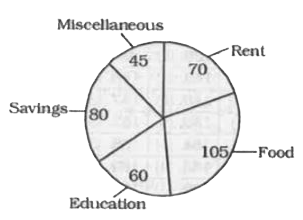
In the given pie-chart, what is the total expenditure on rent?ARs. 8,400BRs. 8,600CRs. 8,800DRs. 8,900Study the given pie chart carefully and answer the question based on it.
Below pie chart given the expenditure (in percentage) on various items and savings of a family during a month.
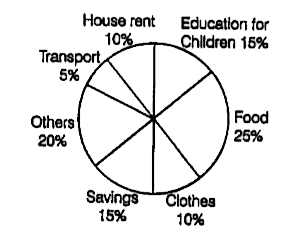
Expenditure on which item is equal to the total savings of the family?AHouse rentBEducation for childrenCFoodDOthersStudy the given pie chart carefully and answer the question based on it.
Pie chart show below gives the expenditure (in percentage) on various items and savings of a family during a month.
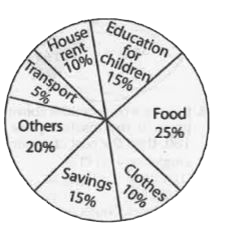
Expenditure on which item is equal to the total savings of the family ?AHouse rentBEducation for chidrenCFoodDOthers
The given pie chart depicts the expenditure incurred in crores towards each sport.
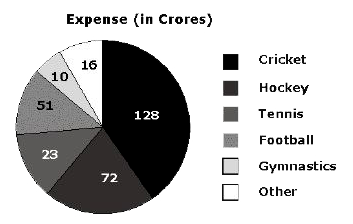
In the given pie chart what is the ratio of expenditure between hockey and gymnastics?
View SolutionThe given pie chart depicts the expenditure incurred in crores towards each sport.
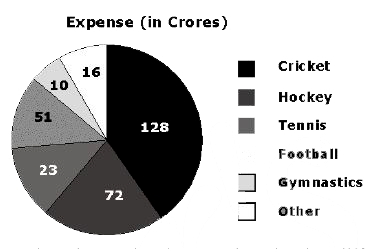
In the given pie chart what is the difference between the expenditure incurred on cricket on football
View SolutionIn the given pie chart total expenditure together on rent and education is what percent less than total expenditure of food and miscellaneous items?
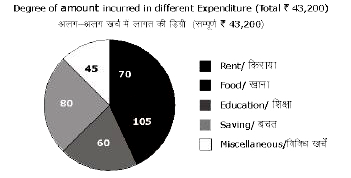
View SolutionIn the given pie chart the expenditure on steel is what percent of the expenditure on cement
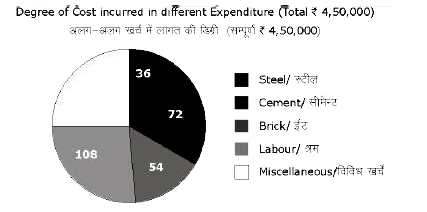
View SolutionStudy the given pie chart carefully and answer the question based on it.
Pie chart show below gives the expenditure (in percentage) on various items and savings of a family during a month.

On which item, the expenditure was minimum ?
View Solution

