The given bar chart shows production of steel by companies A , B , C and D for years 2014 ,2015, 2016
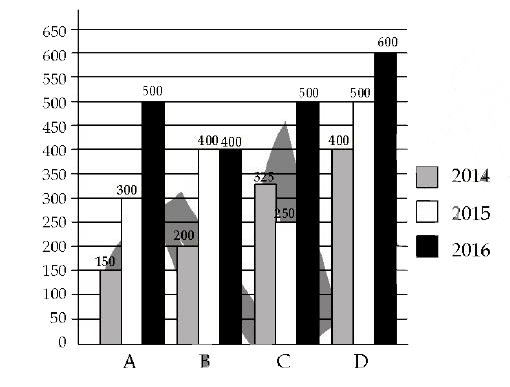
In the given pie chart,what is the percentage production of B in 2014 to the total production of 2014.
0.194
0.2
0.276
0.186
The correct Answer is:D
Step by step video & image solution for The given bar chart shows production of steel by companies A , B , C and D for years 2014 ,2015, 2016 In the given pie chart,what is the percentage production of B in 2014 to the total production of 2014. by Maths experts to help you in doubts & scoring excellent marks in Class 14 exams.
Updated on:21/07/2023Topper's Solved these Questions
Similar Questions
The given bar chart shows production of steel by companies A. B, C and D for years 2014, 2015, 2016 (in tonnes).
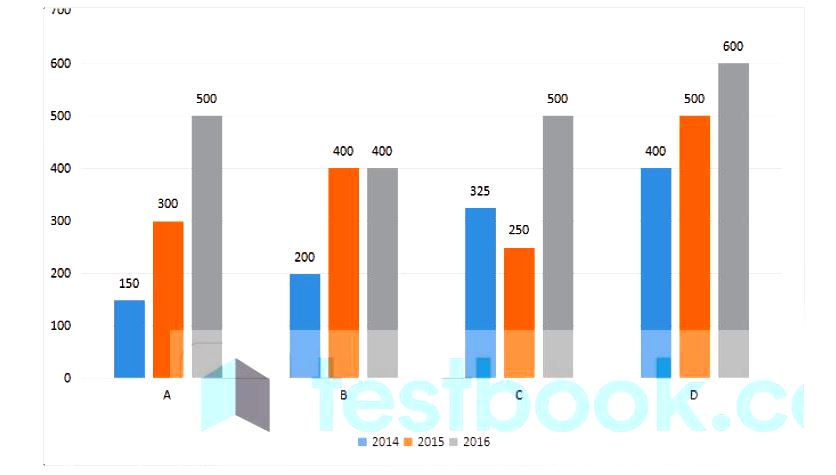
In the given bar-chart, what is the percentage production of ‘B‘ in 2014 to the total production of 2014?
View SolutionThe given bar chart shows production of steel by companies A , B , C and D for years 2014 ,2015, 2016
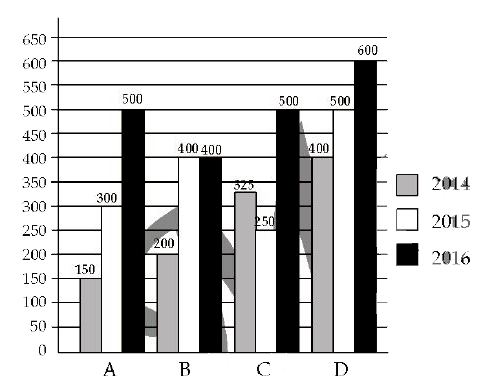
In the given pie chart, the average production of steel at C for the year 2014-2016 is:
View Solution
Knowledge Check
The total production of type A cars in 2016 and type E cars in 2014 taken together is what percent of the total production of type C cars during 2014 to 2018?
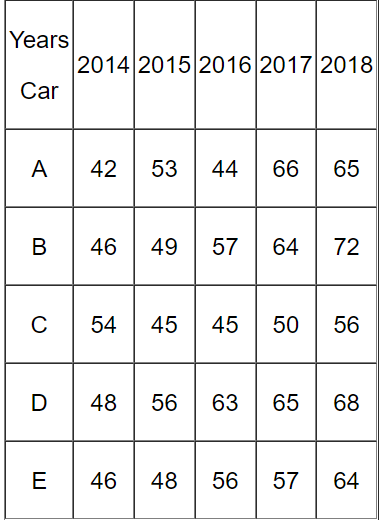 A36B32C35D40
The given bar chart production of steel by companies A , B, c and D for years 2014 ,2015, 2016
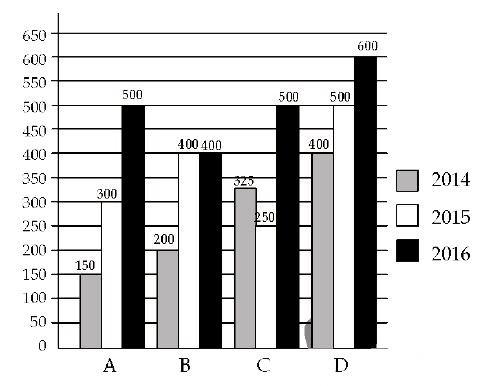
In the given bar chart which company has the maximum total production of steel
View SolutionThe given bar chart shows production of steel by companies A, B, C and D for years 2014, 2015, 2016 (in tonnes).
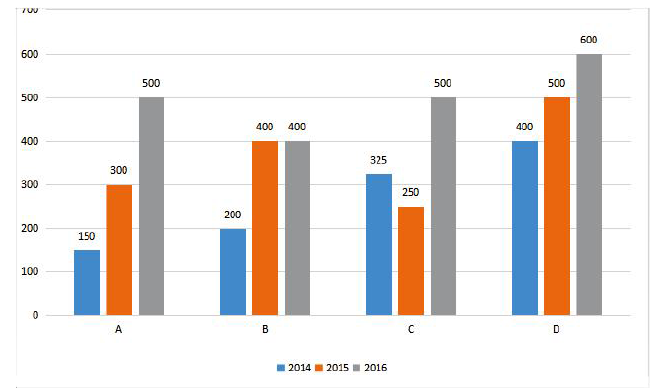
In the given bar-chart, the average production of steel at ‘C’ for the year 2014-2016 is:
View SolutionThe given bar chart shows production of steel by companies A, B, C and D for years 2014, 2015, 2016 (in tonnes).
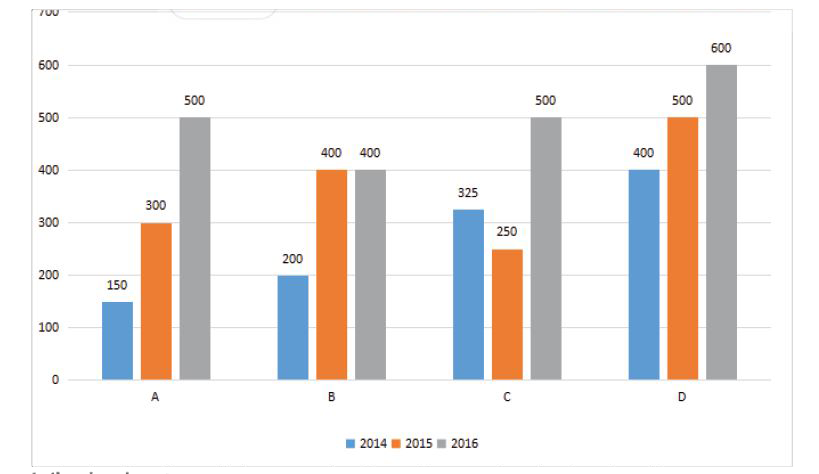
In the given bar-chart, which company has the maximum total production of steel?
View SolutionWhat is the percentage increase in the production of rice in B from 2014 to 2016?
View SolutionThe given bar chart shows the sales of books in four metro branches of a company for the years 2014 and 2015.
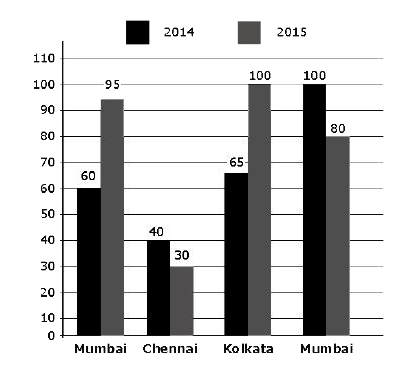
In the given bar chart, calculate the percentage increment of sales between the year 2014 and 2015.
View SolutionThe given bar chart shows the sales of books in four metro branches of a company for the years 2014 and 2015.
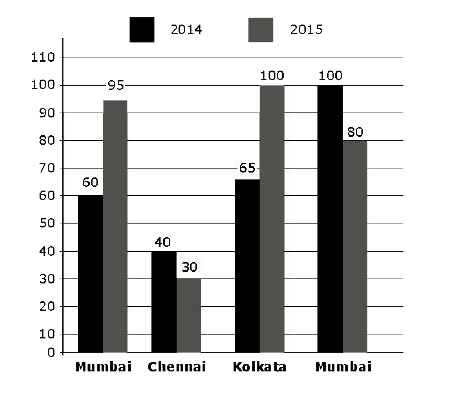
In the given bar chart, which branch has the highest increase in sale in 2015 as compared to 2014?
View SolutionThe given bar chart shows the sales of books in four metro branches ofa company for the years 2014 and 2015
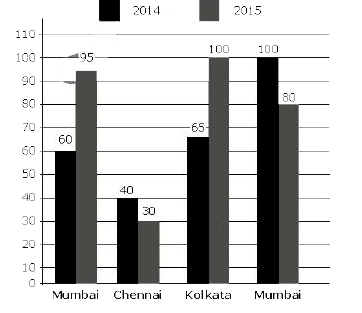
In the given bar chart the ratio the total sales between Mumbai and Delhi is
View Solution
