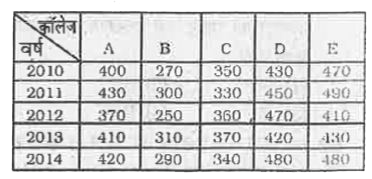
निम्नलिखित तालिका में पिछले पाँच वर्षो ( 2010 से 2014 ) में पाँच कॉलेजों में विद्यार्थियों की संख्या को दर्शाया गया है।

2013 में कॉलेज E में अध्ययन करने वाले कुल विद्यार्थियों की संख्या, 2013 में कॉलेज B,C और D में अध्ययन करने वाले कुल विद्यार्थियों की संख्या का लगभग कितने प्रतिशत है ? (दशमलव के एक स्थान तक सही )
(a) 38.2% (b) 38.6% (c) 39.1% (d) 39.4%
38.2%
38.6%
39.1%
39.4%
The correct Answer is:C
Step by step video, text & image solution for निम्नलिखित तालिका में पिछले पाँच वर्षो ( 2010 से 2014 ) में पाँच कॉलेजों में विद्यार्थियों की संख्या को दर्शाया गया है। 2013 में कॉलेज E में अध्ययन करने वाले कुल विद्यार्थियों की संख्या, 2013 में कॉलेज B,C और D में अध्ययन करने वाले कुल विद्यार्थियों की संख्या का लगभग कितने प्रतिशत है ? (दशमलव के एक स्थान तक सही ) (a) 38.2% (b) 38.6% (c) 39.1% (d) 39.4% by Maths experts to help you in doubts & scoring excellent marks in Class 14 exams.
Topper's Solved these Questions
Similar Questions
यदि A:B=2:3 और B:C=3:7, तो A+B:B+C:C+A क्या होगा?
03:22View SolutionP और Q की वर्तमान आयु के बीच का क्रमशः अनुपात 3 : 4 है। चार वर्ष बाद Q, P से पाँच वर्ष बड़ा होगा।P की वर्तमान आयु कितनी है?
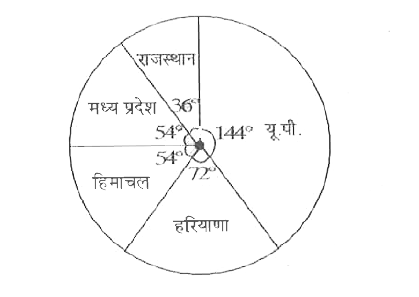
03:22View Solutionचित्र में दिया गया वृत्त चार्ट मई -जून 2013 के दौरान वाहनों का केन्द्र्य सर्कार द्वारा चल्या गये अभियान में कटे हुए चलानो की संख्या को डिग्री (∘ ) में दर्शाता है। इसे ध्यानपूर्वक पढ़िए व निम्न प्रशनो के उत्तर दीजिए।
यदि कुल वाहनों 72 लाख है तो मध्य प्रदेश में कटे चालानों की संख्या राजस्थान के कटे चालानों की संख्या से कितना अधिक है ?
 03:30View Solution
चित्र में दिया गया वृत्त चार्ट मई -जून 2013 के दौरान वाहनों का केन्द्र्य सर्कार द्वारा चल्या गये अभियान में कटे हुए चलानो की संख्या को डिग्री (∘ ) में दर्शाता है। इसे ध्यानपूर्वक पढ़िए व निम्न प्रशनो के उत्तर दीजिए।
यदि कुल वाहनों 72 लाख है तो मध्य प्रदेश में कटे चालानों की संख्या राजस्थान के कटे चालानों की संख्या से कितना अधिक है ?
 01:27View Solution
Study the following pie chart and table to answer the question.Total number of students admitted in a university in various fields = 5000 Distribution of the number of students into various fields: The ratio of the number of boys in Economics to the number of students in Economics is: निम्नांकित पाई चार्ट का अध्ययन कीजिए और उसके बाद दिए गए प्रशन का उत्तर दीजिए। एक विश्वविद्यालय में विभिन्न संकायों में प्रवेश लेने वाले विद्यार्थियों की संख्या 5000 है। विभिन्न संकायों में विद्यार्थियों को संख्या का बंटनः इकोनॉमिक्स में लड़कों की संख्या का, इकोनॉमिक्स में कुल विद्यार्थियों की संख्या से क्या अनुपात हे?
01:47View Solutionविद्यार्थियों की एक पंक्ति में , सोहन का स्थान दोनों मे से किसी भी किनारे से 9 वाँ है तब विद्यार्थियों की कुल संख्या होगी ?
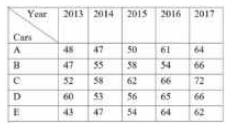
01:58View SolutionThe table shows the production of different types of cars (in thousands).
यह तालिका एक कंपनी द्वारा अलग-अलग कारों के उत्पादन ( हज़ार में ) को दर्शाती है | The total production of type B cars in 2015 and type C cars in 2013 is what percent more than the total production of type E cars in 2013 and 2014 ? (Correct to one decimal place)
2015 में B प्रकार तथा 2013 में प्रकार की कारों का कुल उत्पादन 2013 तथा 2014 में E प्रकार की कारों के कुल उत्पादन से कितना प्रतिशत अधिक है ? (एक दशमलव स्थान तक)02:28View SolutionThe table below shows the number of students enrolled in five colleges over the five years (2010 to 2014). यह तालिका पांच कॉलेजों में पांच वर्षों ( 2010 से 2014 ) के दौरान नामांकन लेने वाले छात्रों की संख्या दर्शाती है | What is the average number of students studying in college D over the given years? इन वर्षों में कॉलेज D में पढ़ने वाले छात्रों की औसत संख्या कितनी है ?
01:34View SolutionThe table below shows the number of students enrolled in five colleges over the five years (2010 to 2014). यह तालिका पांच कॉलेजों में पांच वर्षों ( 2010 से 2014 ) के दौरान नामांकन लेने वाले छात्रों की संख्या दर्शाती है | In the year 2014, what percent of students were enrolled in college C (correct to one decimal place)? वर्ष 2014 में, कितने प्रतिशत छात्रों ने कॉलेज C में नामांकन करवाया था ? ( एक दशमलव स्थान तक )
02:37View SolutionThe table below shows the number of students enrolled in five colleges over the five years (2010 to 2014). यह तालिका पांच कॉलेजों में पांच वर्षों ( 2010 से 2014 ) के दौरान नामांकन लेने वाले छात्रों की संख्या दर्शाती है | What is the ratio of the total students enrolled in colleges A and B in the year 2012 to the total students enrolled in colleges D and E in the year 2013? वर्ष 2012 में कॉलेज A और B में नामांकन लेने वाले कुल छात्रों की संख्या का वर्ष 2013 में कॉलेज D और E में नामांकन लेने वाले कुल छात्रों की संख्या के साथ अनुपात ज्ञात करें|
02:20View SolutionThe table below shows the number of students enrolled in five colleges over the five years (2010 to 2014). यह तालिका पांच कॉलेजों में पांच वर्षों ( 2010 से 2014 ) के दौरान नामांकन लेने वाले छात्रों की संख्या दर्शाती है | The number of students studying in college E in the year 2013 is approximately what percent of the number of students studying in colleges B, C and D taken together in the year 2013 (nearest to one decimal place) वर्ष 2013 में कॉलेज E में पढ़ रहे छात्रों की संख्या वर्ष 2013 में कॉलेज B, C एवं D में पढ़ने वाले छात्रों की कुल संख्या का लगभग कितना प्रतिशत है ? ( एक दशमलव स्थान के निकटतम )
02:06View SolutionThis table shows the number of students studying in various streams in different colleges. निम्नलिखित तालिका पांच कॉलेजों के तीन विषयों में पढ़ने वाले छात्रों की संख्या दर्शाती है | The number of students in the science stream of college C is approximately what percentage of students studying in that college? कॉलेज C में विज्ञान विषय में छात्रों की संख्या उस कॉलेज में पढ़ने वाले छात्रों की संख्या का लगभग कितना प्रतिशत है ?
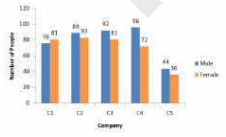
01:14View SolutionThe bar graph given below shows the number of men and women working in the five different companies.
नीचे दिया गया दंड आरेख पाँच विभिन्न कंपनियों में कार्य करने वाले पुरुषों तथा महिलाओं की संख्या को दर्शाता है | The total number of men working in the five companies is approximately what percent more than that of women working in these companies?
इन पांच कंपनियों में कार्य करने वाले पुरुषों की कुल संख्या, इन पांच कंपनियों में कार्य करने वाली महिलाओं की कुल संख्या से (लगभग) कितना प्रतिशत अधिक है ?03:16View SolutionThe number of students enrolled in different streams in a college is shown in the following table:/
निम्नलिखित तालिका में एक कॉलेज के विभिन्न विषयों में नामांकित छात्रों की संख्या दी गयी है : The ratio of total number of boys to that of girls in the college is:
इस कॉलेज में लड़कों की कुल संख्या तथा लड़कियों की कुल संख्या के बीच क्या अनुपात है ?03:33View SolutionThe given Bar Graph presents the number of students of two schools for six years. दिया गया दंड आरेख (बार ग्राफ) छह वर्षो के दौरान दो स्कूलों में विद्यार्थियों की संख्या को दर्शाता है| In which year, the percentage increase in students in school B is the highest in comparison to its previous year? किस वर्ष में, स्कूल B के विद्यार्थियों की संख्या में प्रतिशत वृद्धि इसके पिछले वर्ष की तुलना में सबसे अधिक है?
01:05View SolutionThe given Bar Graph presents the number of students of two schools for six years. दिया गया दंड आरेख (बार ग्राफ) छह वर्षो के दौरान दो स्कूलों में विद्यार्थियों की संख्या को दर्शाता है| In which year, percentage increase of students in school A is the highest in comparison to its previous year ? किस वर्ष में, स्कूल A की विद्याथियों की संख्या में प्रतिशत वृद्धि इसके पिछले वर्ष की तुलना में सबसे अधिक है?
01:41View Solution

