2015 में निर्यात किये गए A, B और D प्रकार के वाहनों की औसत संख्या 2014 में निर्यात किये गए E प्रकार के वाहनों की संख्या में x% कम थी। x का मान क्या है ?
18
24
20
25
The correct Answer is:A
Step by step video, text & image solution for 2015 में निर्यात किये गए A, B और D प्रकार के वाहनों की औसत संख्या 2014 में निर्यात किये गए E प्रकार के वाहनों की संख्या में x% कम थी। x का मान क्या है ? by Maths experts to help you in doubts & scoring excellent marks in Class 14 exams.
Updated on:21/07/2023Topper's Solved these Questions
Similar Questions
यदि A:B=2:3 और B:C=3:7, तो A+B:B+C:C+A क्या होगा?
View SolutionP और Q की वर्तमान आयु के बीच का क्रमशः अनुपात 3 : 4 है। चार वर्ष बाद Q, P से पाँच वर्ष बड़ा होगा।P की वर्तमान आयु कितनी है?
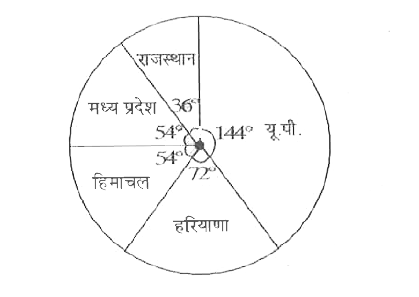
View Solutionचित्र में दिया गया वृत्त चार्ट मई -जून 2013 के दौरान वाहनों का केन्द्र्य सर्कार द्वारा चल्या गये अभियान में कटे हुए चलानो की संख्या को डिग्री (∘ ) में दर्शाता है। इसे ध्यानपूर्वक पढ़िए व निम्न प्रशनो के उत्तर दीजिए।
यदि कुल वाहनों 72 लाख है तो मध्य प्रदेश में कटे चालानों की संख्या राजस्थान के कटे चालानों की संख्या से कितना अधिक है ?

View SolutionThe table shows the production of different types of cars (in thousands). यह तालिका अलग-अलग प्रकार के कारों का उत्पादन ( हज़ार में) दर्शाती है | What is the ratio of the total production of cars of type A in 2014 and type C in 2013 taken together to the total production of cars of type B in 2016 and type E in 2015 taken together? 2014 में A प्रकार की कारों और 2013 में C प्रकार की कारों के कु ल उत्पादन का 2016 में B प्रकार की कारों और 2015 में E प्रकार की कारों के कुल उत्पादन के साथ अनुपात ज्ञात करें |
View SolutionThe given bar graph presents the number of different types of vehicles (in lakhs) exported by a company during 2014 and 2015. दिया गया दंड आरेख एक कंपनी के द्वारा 2014 और 2015 में निर्यात किये गए अलग-अलग प्रकार के वाहनों की संख्या ( लाख में ) को दर्शाता है | The total number of type B,D and E vehicles exported in 2014 is what percentage of the total number of type A, C, D and E vehicles exported in 2015 (correct to one decimal place)? 2014 में निर्यातित B, D एवं Eप्रकार के कुल वाहनों की संख्या 2015 में निर्यात किये गए A, C, D एवं E प्रकार के वाहनों की कुल संख्या का कितना प्रतिशत है ?
View SolutionThe given bar graph presents the number of different types of vehicles (in lakhs) exported by a company during 2014 and 2015. दिया गया दंड आरेख एक कंपनी के द्वारा 2014 और 2015 में निर्यात किये गए अलग-अलग प्रकार के वाहनों की संख्या ( लाख में ) को दर्शाता है | What is the ratio of the total number of type A and C vehicles exported in 2014 to the total number of type B and E vehicles exported in 2015? 2014 में निर्यात किये गए A और C प्रकार के वाहनों की कुल संख्या का 2015 में निर्यात किये गए B एवं E प्रकार के वाहनों की कुल संख्या के साथ अनुपात ज्ञात करें |
View SolutionThe given bar graph presents the number of different types of vehicles (in lakhs) exported by a company during 2014 and 2015. दिया गया दंड आरेख एक कंपनी के द्वारा 2014 और 2015 में निर्यात किये गए अलग-अलग प्रकार के वाहनों की संख्या ( लाख में ) को दर्शाता है | Which type of vehicle showed 32% increase in export in 2015 as compared to that in the previous year? किस प्रकार के वाहन के निर्यात में पिछले वर्ष की तुलना में 2015 में 32% की वृद्धि देखने को मिली ?
View SolutionThe given bar graph presents the number of different types of vehicles (in lakhs) exported by a company during 2014 and 2015.
दिया गया दंड आरेख एक कंपनी के द्वारा 2014 और 2015 में निर्यात किये गए अलग-अलग प्रकार के वाहनों की संख्या ( लाख में ) को दर्शाता है |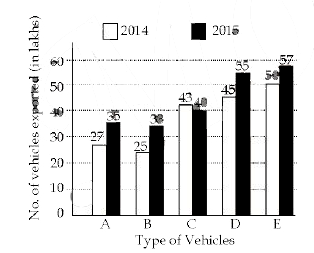 The average number of type A, B and D vehicles exported in 2015 was x% less than the number of type E vehicles exported in 2014. What is the value of x?
2015 में निर्यात किये गए A, B और D प्रकार के वाहनों की औसत संख्या 2014 में निर्यात किये गए E प्रकार के वाहनों की संख्या से x% कम थी | x का मान क्या है ?
View SolutionThe bar graph shows the exports of Cars of Type A and B (in Rs millions).
यह दंड आरेख A और B प्रकार की कारों का निर्यात ( दस लाख रुपये में) दर्शाता है |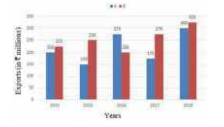 The total exports of cars of type A in 2014 to 2017 is approximately what percentage less than the total exports of cars of type B in 2015 to 2018?
A प्रकार की कारों का 2014 से 2017 तक कुल निर्यात B प्रकार की कारों के 2015 से 2018 तक के कुल निर्यात से लगभग कितना प्रतिशत कम है ?
View SolutionThe given Bar Graph presents Different Type of Vehicles (in lakhs) exported by a company in 2016 and 2017. दिया गया दंड आरेख 2016 और 2017 में एक कंपनी के द्वारा निर्यात किये गए अलग-अलग प्रकार के वाहनों ( लाख में ) को दर्शाता है | The export of which type of vehicle in 2017 is approximately 18.3% more than the export of same type of vehicle in 2016? 2017 में किस प्रकार के वाहन का निर्यात 2016 में इसी वाहन के निर्यात से लगभग 18.3% अधिक है ?
View SolutionThe given Bar Graph presents the number of different types of vehicles exported by a company in 2017 and 2018.The average export of vehicles in 2018 is what percent more than the export of vehicle A in 2017?
दिया गया दंड आरेख एक कंपनी के द्वारा 2017 और 2018 में निर्यात किये गए अलग-अलग प्रकार के वाहनों की संख्या को दर्शाता है |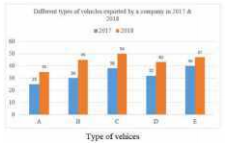
2018 में वाहनों का औसत निर्यात 2017 में वाहन A के निर्यात से कितना प्रतिशत अधिक है ?
View SolutionThe given Bar Graph presents the number of different types of vehicles exported by a company in 2017 and 2018.What is the ratio of the total number of vehicles exported in 2017 of types B, C and D to that of vehicles exported in 2018 of the types A, D and E?
दिया गया दंड आरेख एक कंपनी के द्वारा 2017 और 2018 में निर्यात किये गए अलग-अलग प्रकार के वाहनों की संख्या को दर्शाता है |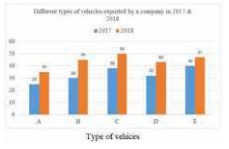
2017 में निर्यात किये गए B, C और D प्रकार के वाहनों की कुल संख्या का 2018 में निर्यात किये गए A, D और E प्रकार के वाहनों की संख्या के साथ अनुपात ज्ञात करें |
View SolutionThe given Bar Graph presents the number of different types of vehicles exported by a company in 2017 and 2018.The increase in the exports in 2018 as compared to that in 2017 is closest to 32% in case of vehicles of type:
दिया गया दंड आरेख एक कंपनी के द्वारा 2017 और 2018 में निर्यात किये गए अलग-अलग प्रकार के वाहनों की संख्या को दर्शाता है |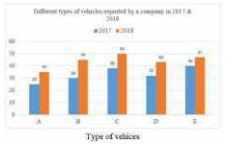
किस प्रकार के वाहनों के मामले में 2017 की तुलना में 2018 में निर्यात में हुई वृद्धि 32% के लगभग है :
View SolutionThe given table represents the number of engineers recruited by four companies A,B,C and D over the years. Study the table carefully and answer the questions that follows: The ratio of the total number of engineers recruited by companies A and B in 2015 and 2018 to the total number of engineers recruited by C and D in 2014 and 2018 is: दी गयी तालिका चार कंपनियों A, B, C और D के द्वारा इन वर्षों के दौरान भर्ती किये गए इंजीनियरों की संख्या दर्शाती है | इस तालिका का ध्यानपूर्वक अध्ययन करें तथा इसके बाद पूछे गए प्रश्न का उत्तर दें | कंपनी A और B के द्वारा 2015 और 2018 में भर्ती किये गए इंजीनियरों की कुल संख्या एवं C तथा D के द्वारा 2014 और 2018 में भर्ती किये गए इंजीनियरों की कुल संख्या के बीच अनुपात ज्ञात करें |
View SolutionThe given table represents the number of engineers recruited by four companies A,B,C and D over the years. Study the table carefully and answer the questions that follows: The number of years in which the number of engineers recruited by company D is less than the average number of engineers recruited by company B in the given six years, is: दी गयी तालिका चार कंपनियों A, B, C और D के द्वारा इन वर्षों के दौरान भर्ती किये गए इंजीनियरों की संख्या दर्शाती है | इस तालिका का ध्यानपूर्वक अध्ययन करें तथा इसके बाद पूछे गए प्रश्न का उत्तर दें | ऐसे कितने वर्ष हैं जिनमें कंपनी D के द्वारा भर्ती किये गए इंजीनियरों की संख्या दिए गए छः वर्षों की अवधि में कंपनी B के द्वारा भर्ती किये गए इंजीनियरों की औसत संख्या से कम है?
View Solution
