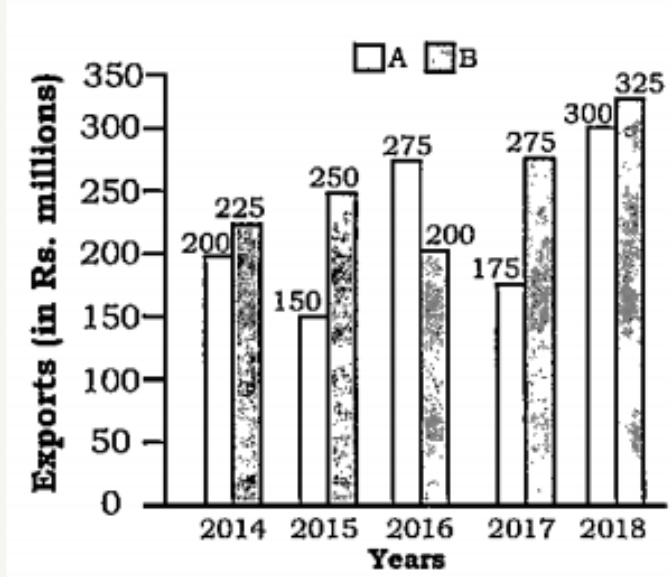
2015 और 2018 में संस्थान A में नामांकित विधार्थियो की कुल संख्या तथा 2014 और 2016 संस्थान B में नामांकित विधार्थियो की कुल संख्या का अनुपात क्या है ?
9:10
16:15
27:25
11:12
The correct Answer is:A
Step by step video, text & image solution for 2015 और 2018 में संस्थान A में नामांकित विधार्थियो की कुल संख्या तथा 2014 और 2016 संस्थान B में नामांकित विधार्थियो की कुल संख्या का अनुपात क्या है ? by Maths experts to help you in doubts & scoring excellent marks in Class 14 exams.
Topper's Solved these Questions
Similar Questions
यदि A:B=2:3 और B:C=3:7, तो A+B:B+C:C+A क्या होगा?
01:49View SolutionP और Q की वर्तमान आयु के बीच का क्रमशः अनुपात 3 : 4 है। चार वर्ष बाद Q, P से पाँच वर्ष बड़ा होगा।P की वर्तमान आयु कितनी है?
04:03View SolutionThe bar graph shows the exports of Cars of Type A and B (in Rs. million).
दिए गए दंड आरेख में टाइप A और B कारो के निर्यात को दर्शाया गया है (मिलियन रु. में) What is the ratio of the exports of cars of Type A in 2014 and 2018 to the total exports of cars of type B in 2015 and 2016?
2014 और 2018 में टाइप A कारो के कुल निर्यात और 2015 और 2016 में टाइप B कारो के कुल निर्यात का अनुपात क्या हे?01:32View SolutionThe ratio of the number of boys in sections A and B of a class is 2 : 3 and the ratio between the total number of boys and girls in sections A and B is 3 : 4. If the number of girls in B is 50% of the number of boys in B, then what will be the ratio between the number of girls in A and B ?
एक कक्षा के अनुभाग A और B में लड़कों की संख्या का अनुपात 2:3 है तथा अनुभाग A और B में लड़कों और लड़कियों की कुल संख्या का अनुपात 3:4 है | यदि 8 में लड़कियों की संख्या, B में लड़कों की संख्या की 50% है, तो A और B में लड़कियों की संख्या का अनुपात कितना होगा ?01:48View SolutionThe given Bar Graph presents Income and Expenditure (in crores of Rupees) of a company for the five years, 2014 to 2018. दिया गया दंड आरेख पांच वर्षों अर्थात 2014 से 2018 तक एक कंपनी के आय एवं व्यय ( करोड़ रुपये में ) को दर्शाता है | What is the ratio of the total revenue of the company in 2015 and 2018 to that of its expenditure in 2014 and 2018? 2015 तथा 2018 में कंपनी की कुल आय और 2014 तथा 2018 में कंपनी के कुल व्यय में क्या अनुपात है ?
01:23View SolutionIn the given bar graph, the percentage decrease in the number of students in Institute A in 2016 is what percent of students in 2015. इस दंड आरेख में संस्थान A में 2016 में छात्रों की संख्या में प्रतिशत कमी 2015 के छात्रों की संख्या का क्या प्रतिशत है ?
03:09View SolutionThe Table shows the Number of Laptops and Desktops manufactured by a company. यह तालिका किसी कंपनी के द्वारा निर्मित लैपटॉप एवं डेस्कटॉप की संख्या को दर्शाती है | What was the difference in the total number of Laptops and Desktops manufactured in 2009 to the total number of Laptops and Desktops manufactured in 2011? 2009 में निर्मित लैपटॉप तथा डेस्कटॉप की कुल संख्या तथा 2011 में निर्मित लैपटॉप और डेस्कटॉप की कुल संख्या में क्या अंतर है ?
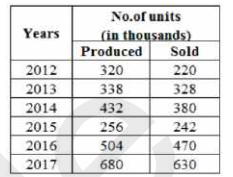
02:41View SolutionThe table given below shows the number of units of a product produced and sold by a company in 6 years.
निम्न तालिका एक कंपनी द्वारा छह वर्षों के दौरान उत्पादित और बेचे गए उत्पाद की यूनिटों की संख्या दर्शाती है| Find the ratio of the total number of units sold in 2013 and 2015 to the number of units produced in
2015 and 2016?
2013 और 2015 में बेची गई उत्पाद के यूनिटों की कुल संख्या तथा 2015 और 2016 में उत्पादित यूनिटों की संख्या का अनुपात ज्ञात कीजिए ?03:11View SolutionThe given table represents the number of engineers recruited by four companies A,B,C and D over the years. Study the table carefully and answer the questions that follows: The ratio of the total number of engineers recruited by companies A and B in 2015 and 2018 to the total number of engineers recruited by C and D in 2014 and 2018 is: दी गयी तालिका चार कंपनियों A, B, C और D के द्वारा इन वर्षों के दौरान भर्ती किये गए इंजीनियरों की संख्या दर्शाती है | इस तालिका का ध्यानपूर्वक अध्ययन करें तथा इसके बाद पूछे गए प्रश्न का उत्तर दें | कंपनी A और B के द्वारा 2015 और 2018 में भर्ती किये गए इंजीनियरों की कुल संख्या एवं C तथा D के द्वारा 2014 और 2018 में भर्ती किये गए इंजीनियरों की कुल संख्या के बीच अनुपात ज्ञात करें |
01:14View SolutionThe given table represents the production of different types of motorcycles (in thousands) over a period of six years. Study the table carefully and answer the questions that follows: दी गयी तालिका छः वर्षों की अवधि के दौरान अलग-अलग प्रकार की मोटर साइकिलों के उत्पादन ( हज़ार में ) को दर्शाती है | इस तालिका का ध्यानपूर्वक अध्ययन करें तथा फिर पूछे गए प्रश्नों का उत्तर दीजिए | What is the ratio of the total number of motorcycles of type B produced in 2016 and 2018 to the total number of motorcycles of type D produced in 2013, 2015 and 2016? 2016 तथा 2018 में उत्पादित की गयी B प्रकार की मोटरसाइकिलों की कुल संख्या का 2013, 2015 और 2016 में उत्पादिति D प्रकार की मोटरसाइकिलों की कुल संख्या के साथ अनुपात ज्ञात कीजिए |
02:27View SolutionThe number of students enrolled in different streams in a college is shown in the following table:/
निम्नलिखित तालिका में एक कॉलेज के विभिन्न विषयों में नामांकित छात्रों की संख्या दी गयी है : The ratio of total number of boys to that of girls in the college is:
इस कॉलेज में लड़कों की कुल संख्या तथा लड़कियों की कुल संख्या के बीच क्या अनुपात है ?05:39View SolutionThe given bar graph represents the number of students admitted in four schools (S1, S2, S3, S4) during two consecutive years 2017 and 2018.
दिया गया दंड आरेख चार स्कूलों (S1, S2, S3, S4) में लगातार दो साल 2017 और 2018 के दौरान नामांकित छात्रों की संख्या को प्रदर्शित करता है। The ratio between total number of students admitted in the four schools in 2017 to the total
number of students in the four schools in 2018 is:
2017 में चार स्कूलों नामांकित में कुल छात्रों की संख्या और 2018 में चार स्कूलों में नामांकित कुल छात्रों की संख्या के बीच अनुपात है:01:43View SolutionThe given Bar Graph presents the number of students enrolled for vocational course institutes A and B during a period of 5 years. In which year the number of students enrolled in B is x% more, where 25 lt x lt 30 , then the number of students enrolled in A in the same year? दिया गया दंड आरेख (बार ग्राफ) 5 वर्ष की अवधि के दौरान संस्थान A और B में व्यावसायिक पाठ्यक्रम के लिए नामांकित विद्यार्थियों की संख्या को दर्शाता है| किस वर्ष में संस्थान B में नामांकित विद्यार्थियों की संख्या उसी वर्ष संस्थान A में नामांकित विद्यार्थियों की संख्या से x % अधिक है, जहां 25 lt x lt 30 है?
View SolutionThe given Bar Graph presents Income and Expenditure (in crores of Rupees) of a company for five years, 2014 to 2018. What is the ratio of total Expenditure to total Income of the company in 2014,2016 and 2017? दिया गया दंड आरेख (बार ग्राफ) 5 वर्षों, 2014 से 2018 के दौरान किसी कंपनी की आय और व्यय (करोड़ रुपए में) को दर्शाता है| 2014, 2016 और 2017 में कंपनी के कुल व्यय और कुल आय का अनुपात क्या है?
View Solutionबोरेक्स में बोरॉन-ऑक्सीजन बंधों की कुल संख्या 'x' है और बोरॉन ऑक्सीजन-बोरॉन बंधों की 'y' है। तो x - y का मान है:
View Solutionक्रोमते और डिक्रोमते अयानो में क्रोमियम और ऑक्सीजन परमणुओ के बिच सिग्मा बन्दों की कुल संख्या का योगफल है
View Solution

