पांच वित्त वर्षो के दौरान निर्यातों और आयतो के बीच के निरपेक्ष अंतर का औसत (टन में) कितना है ?
266
260
264
256
The correct Answer is:A
Topper's Solved these Questions
Similar Questions
यदि A:B=2:3 और B:C=3:7, तो A+B:B+C:C+A क्या होगा?
View SolutionP और Q की वर्तमान आयु के बीच का क्रमशः अनुपात 3 : 4 है। चार वर्ष बाद Q, P से पाँच वर्ष बड़ा होगा।P की वर्तमान आयु कितनी है?
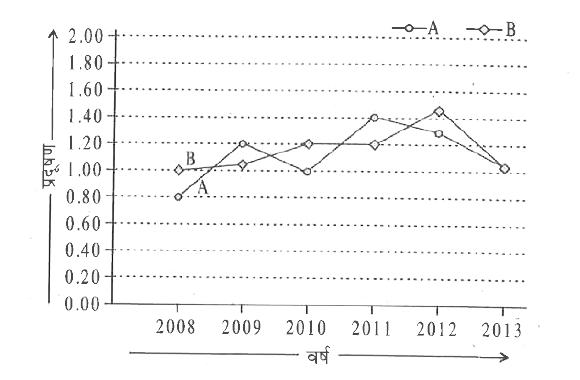
View Solutionनिचे दिये गये ग्राफ में दो प्रकार के वाहनों A व B के छ वर्षो के प्रदूषण का आंकड़ा दिया गया है ।A घरेलू वाहनों तथा B व्यावसायिक वाहनों को दर्शाता है ,तो ग्राफ का अध्ययन क्र आगे दिये गये प्रशनो के उत्तर दीजिए|
दिये गये वर्षो में B का औसत प्रदूषण कितना है ?

View Solutionनिचे दिये गये ग्राफ में दो प्रकार के वाहनों A व B के छ वर्षो के प्रदूषण का आंकड़ा दिया गया है ।A घरेलू वाहनों तथा B व्यावसायिक वाहनों को दर्शाता है ,तो ग्राफ का अध्ययन क्र आगे दिये गये प्रशनो के उत्तर दीजिए|
दिये गये वर्षो में B का औसत प्रदूषण कितना है ?

View SolutionWhat is the difference between 0.9 and 0.9% ?
0.9 और 0.9% के बीच का अंतर है ?
View SolutionIf the difference between 62% and 80% of a number is 198, then the difference between 92% and 56% of the number will be:
यदि एक संख्या के 62% और 80% में 198 का अंतर है, तो उस संख्या के 92% और 56% में कितना अंतर होगा?
View SolutionThe table shows the production of different types of cars (in thousands). यह तालिका एक कंपनी द्वारा अलग-अलग कारों के उत्पादन (हज़ार में ) को दर्शाती है | The average production of type A cars during the five years is what percent of the total production of type C cars during the five years? पांच वर्षों के दौरान A प्रकार की कारों का औसत उत्पादन पांच वर्षों के दौरान C प्रकार की कारों के कुल उत्पादन का कितना प्रतिशत है ?
View SolutionThe given Bar Graph presents the Imports and Exports of an item (in tonnes) manufactured by a company for the five financial years, 2013-2014 to 2017-2018. दिया गया दंड आरेख पांच वित्तीय वर्षो अर्थत 2013-2014 से 2017-2018 तक एक कंपनी के द्वारा निर्मित किसी वस्तु के आयात और निर्यात ( टन में ) को दर्शाता है | What is the average of Exports (in tonnes) during the five financial years? पांच वित्तीय वर्षों के दौरान निर्यात (टन ) का औसत कया रहा है ?
View SolutionThe given Bar Graph presents the Imports and Exports of an item (in tonnes) manufactured by a company for the five financial years, 2013-2014 to 2017-2018. दिया गया दंड आरेख पांच वित्तीय वर्षो अर्थत 2013-2014 से 2017-2018 तक एक कंपनी के द्वारा निर्मित किसी वस्तु के आयात और निर्यात ( टन में ) को दर्शाता है | What is the average of total Import and Export (in tonnes) during the five financial year? पांच वित्तीय वर्षों के दौरान कुल आयात एवं निर्यात का औसत ( टन में)क्या है ?
View Solutionप्राथमिक और जटिल अभिक्रियाएं#!#आणविकता और कोटि के बीच अंतर
View Solutionप्राथमिक और जटिल अभिक्रियाएं#!#आणविकता और कोटि के बीच अंतर
View SolutionThe given Bar Graph presents the Imports and Exports of an item (in tonnes) manufactured by a company for the five financial years, 2013-2014 to 2017-2018. दिया गया दंड आरेख (बार ग्राफ) 5 वित्त वर्षों, 2013-2014 से 2011-2018 के दौरान एक कंपनी द्वारा निर्मित किसी वस्तु (टन में) के आयात और निर्यात को दर्शाता है | What is the average of Export (in tonnes) during the five financial years? 5 वित्त वर्षों के दौरान निर्यात (टन में] का औसत कितना है?
View SolutionThe given Bar Graph present the Imports and Exports of an item (in tonnes) manufactured by a company for the five financial years, 2013-2014 to 2017-2018. दिया गया दंड आरेख (बार ग्राफ) पांच वित्त वर्षों, 2013-2014 से 2017-2018, के दौरान किसी कंपनी दवारा निर्यात किसी वस्तु (टन में] के आयात और निर्यात को दर्शाता है| What is the average of total Import and Export (in tonnes) during five financial years? पांच वित्त वर्षो के दौरान कुल आयात और निर्यात (टन में) का औसत क्या है?
View SolutionThe given Bar Graph present the Imports and Exports of an item (in tonnes) manufactured by a company for the five financial years, 2013-2014 to 2017-2018. दिया गया दंड आरेख (बार ग्राफ) पांच वित्त वर्षों, 2013-2014 से 2017-2018, के दौरान किसी कंपनी दवारा निर्यात किसी वस्तु (टन में] के आयात और निर्यात को दर्शाता है| In which financial year, the absolute difference of the Export to those of Imports is the lowest? किस वित्त वर्ष में नियात और आयात ओ का निरपेक्ष अंतर [absolute difference) सबसे कम है?
View SolutionThe given Bar Graph present the Imports and Exports of an item (in tonnes) manufactured by a company for the five financial years, 2013-2014 to 2017-2018. दिया गया दंड आरेख (बार ग्राफ) पांच वित्त वर्षों, 2013-2014 से 2017-2018, के दौरान किसी कंपनी दवारा निर्यात किसी वस्तु (टन में] के आयात और निर्यात को दर्शाता है| What is the ratio of total Imports to total Exports during 2014- 2015, 2015- 2016 and 2016- 2017? वर्ष 2014-2015, 2015-2016 33 2016-2011 के दौरान, कुल आयात और निर्यातों का अनुपात कितना है?
View Solutionकॉपर के निष्कर्षण में प्रगलन प्रक्रम के दौरान बनने वाले धातुमल का रासायनिक संघटन होता है-
View Solution
