The results of two colleges are as follows :
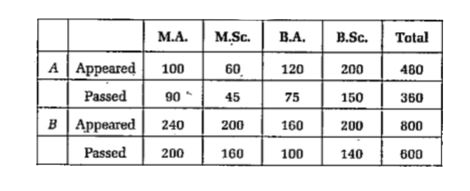 then
then
A is better than B
none is better than the other
A is inderior to B
cannot say
The correct Answer is:B
Topper's Solved these Questions
- MEASURES OF CENTRAL TENDENCY BOOK - ML KHANNACHAPTER - MEASURES OF CENTRAL TENDENCY EXERCISE - Problem Set (1) (Measures of Disperation)
23 Videos
- MEASURES OF CENTRAL TENDENCY BOOK - ML KHANNACHAPTER - MEASURES OF CENTRAL TENDENCY EXERCISE - SELF ASSESSMENT TEST
5 Videos
- MEASURES OF CENTRAL TENDENCY BOOK - ML KHANNACHAPTER - MEASURES OF CENTRAL TENDENCY EXERCISE - ASSERTION / REASON
1 Videos
- MAXIMA AND MINIMA BOOK - ML KHANNACHAPTER - MAXIMA AND MINIMA EXERCISE - MISCELANEOUS EXERCISE (COMPREHENSION)
3 Videos
- NUMERICAL METHODSBOOK - ML KHANNACHAPTER - NUMERICAL METHODSEXERCISE - SELF ASSESSMENT TEST
10 Videos
Similar Questions
Majority of the students who appeared in the final examination of postgraduate course in management in the local college have secured first class, which is comparatively higher than the performance of students of other management colleges in the state.
Which of the following may indicate that the results are not in line with the general trend ?
1) The students of the local college are qualitatively better than those of other colleges.
2) The authorities of the other management colleges in the state are stricter in their standard of evaluation.
3) The students of other management colleges in the state performed better than the students of the local college in all the previous examinations.
4) The local management college recently retrenched many of its regular faculty members.
5) None of these
View SolutionOn the set of all colleges in a state, a relation R is defined such that two colleges are related if they belong to the same district. Find the properties satisfied by R.
View Solution
Knowledge Check
The resultant of two vectors will be minimum, if they are
Aequal vectorsBparallel vectorsCcoplanar vectorsDperpendicular to each other.The sum-divided bar-diagram given below depicts the result of B.Sc. Students of a college for three years.
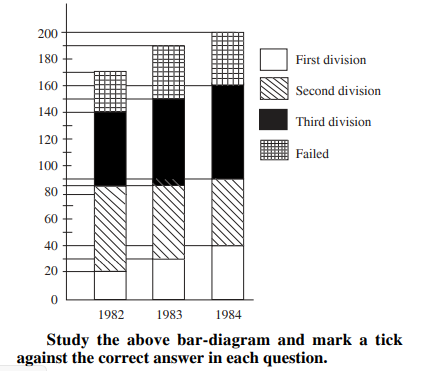
In which year the college had the best result for B.Sc .?A1982B1983C1984DNone of theseThe sum-divided bar-diagram given below depicts the result of B.Sc. Students of a college for three years.
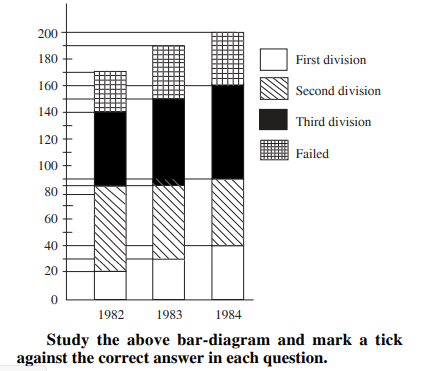
What was the pass percentage in 1982 ?A65%B70%C74.6%D88.8%
The sum-divided bar-diagram given below depicts the result of B.Sc. Students of a college for three years.
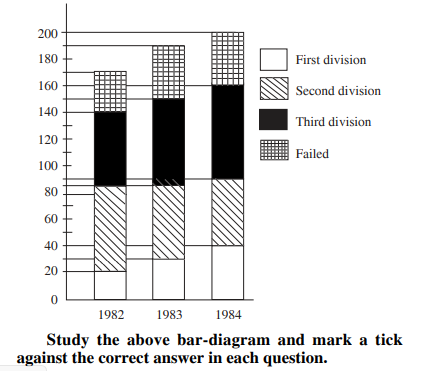
What is the number of third divisions in 1984 ?
View SolutionThe sum-divided bar-diagram given below depicts the result of B.Sc. Students of a college for three years.
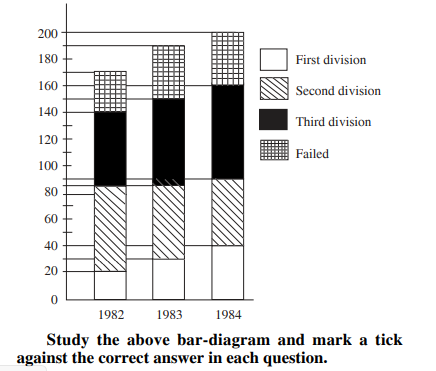
What is the percentage of students in 1984 over 1982 ?
View SolutionTwo statements are given ,followed by three conclusions numbered I,II and III .Assuming the statements to be true even if they seem to be variance with commonly known facts ,decide which of the conclusions logically follow(s) from the statements .
Statements :
Some colleges are schools
No ground is a college .
Conclisions :
I.No college is a ground.
II No School is a college .
III . Some schools are colleges .
View SolutionThe ratio of boys and girls in a college is 5:3. If 50 boys leave the college and 50 girls join the college, the ratio becomes 9:7. The number of boys in the college is:
View SolutionThe magnitude of the resultant of two vectors is maximum in which of the following case ?
View Solution
