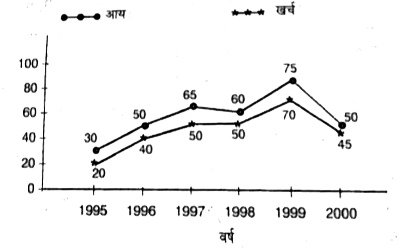
एक कम्पनी की आय और खर्च (×100 करोड़ रुपये में)

यदि 1999 में आय 9500 करोड़ रुपये थी तब 1998, 1999 और 2000 की औसत आय क्या (करोड़ रुपये में) थी।
6500
620023
683313
781119
The correct Answer is:D
Step by step video, text & image solution for एक कम्पनी की आय और खर्च (xx 100 करोड़ रुपये में) यदि 1999 में आय 9500 करोड़ रुपये थी तब 1998, 1999 और 2000 की औसत आय क्या (करोड़ रुपये में) थी। by Maths experts to help you in doubts & scoring excellent marks in Class 14 exams.
Topper's Solved these Questions
- BOOK - MAHESH MISHRACHAPTER - ग्राफEXERCISE - 29 C प्रतियोगी परीक्षाओं हेतु अभ्यास प्रश्नमाला71videos
ग्राफ
- BOOK - MAHESH MISHRACHAPTER - ग्राफEXERCISE - 29 C प्रतियोगी परीक्षाओं हेतु अभ्यास प्रश्नमाला71videos
ग्राफ
- BOOK - MAHESH MISHRACHAPTER - क्रमचय और संचयEXERCISE - 26 C (प्रतियोगी परीक्षाओं हेतु अभ्यास प्रश्नमाला)35videos
क्रमचय और संचय
- BOOK - MAHESH MISHRACHAPTER - घातांक एंव करणीEXERCISE - 4 C (प्रतियोगी परीक्षाओं हेतु अभ्यास प्रश्नमाला)90videos
घातांक एंव करणी
Similar Questions
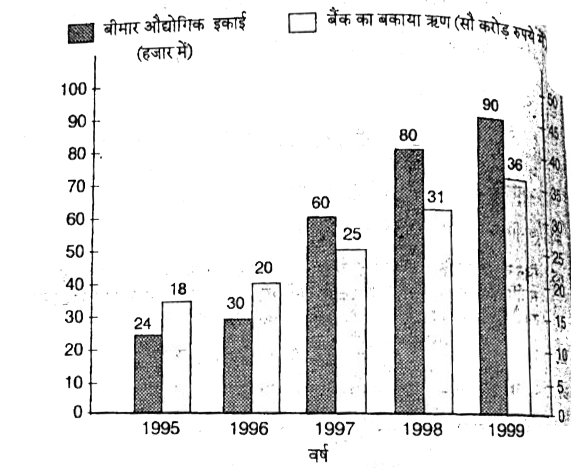
विभिन्न वर्षों में बीमार औद्योगिक इकाईयों की संख्या (×1000) तथा बैंक का बकाया ऋण (×100) करोड़ रुपये में

किस वर्ष बैंक का ऋण प्रति बीमार इकाई अधिकतम था ?02:11View Solutionविभिन्न वर्षों में बीमार औद्योगिक इकाईयों की संख्या (×1000) तथा बैंक का बकाया ऋण (×100) करोड़ रुपये में

किस वर्ष बैंक का ऋण प्रति बीमार इकाई अधिकतम था ?02:45View Solution8 छात्र गणित विषय के, 7 छात्र विज्ञान के तथा 4 छात्र अंग्रेजी विषय के है। कितने तरीके से इन छात्रों को स्कॉलरशिप दिए जा सकते हैं यदि यह सर्वोच्च स्थान प्राप्त करनेवालों को ही दिया जाता है ?
02:17View Solution81√0.04=?
05:41View SolutionDetermine the point of symmetry of a regular hexagon.
02:10View SolutionMatch the following Column A to Column B
 02:17View Solution
Match the following Column A to Column B
 02:10View Solution
Match the following Column A to Column B
 03:54View Solution
The inequation represented by the graph given below is :
03:54View SolutionThe inequation that best describes the graph given below is _________
04:19View SolutionThe inequation that best describes the following graph is _________
03:24View Solutionनिम्नलिखित आंकड़ों का बहुलक ज्ञात करें।
(आय रुपये में,500-600,400-500,300-400,200-300,100-200),(व्यक्तियों की सं.,17,20,30,18,15):}03:32View SolutionFind the mode of the following data. {:("आय रुपये में",500-600,400-500,300-400,200-300,100-200),("व्यक्तियों की सं.,17,20,30,18,15):}
02:25View SolutionThe ratio of the income of A to that of B is 5:7. A and B save Rs. 4000 and Rs. 5000 respectively. If the expenditure of A is equal to 6623% of the expenditure of B, then the total income of A and B is :
A की आय और B की आय में 5 : 7 का अनुपात है | A और B महीने में क्रमश 4000 और 5000 रुपये की बचत करते हैं | यदि A का व्यय B के व्यय के 6623% के बराबर है, तो A और B की कुल आय ज्ञात करें |01:49View SolutionThe ratio of income of A and B last year was 4:3, respectively. The ratios of their individual incomes of the last year and the present year are 3:4 and 5:6, respectively. If their total income for the present year is Rs. 8.04 lakh, then the income of B last year was :
पिछले वर्ष A और B की आय का अनुपात क्रमशः 4 : 3 था | पिछले वर्ष और इस वर्ष की उनकी आय का अनुपात क्रमशः 3 :4 और 5 : 6 है | यदि वर्तमान वर्ष के लिए उनकी कुल आय 8.04 लाख रुपये है, तो पिछले वर्ष B की आय कितनी थी ?04:17View SolutionA, B and C spend 80%, 85% and 75% of their incomes, respectively. If their savings are in the ratio 8:9:20 and the difference between the incomes of A and C is Rs. 18,000 , then the income of B is :
A, B और C अपनी आय का क्रमशः 80%, 85% और 75% खर्च करते हैं | यदि उनकी बचत 8 : 9 : 20 के अनुपात में है और A तथा C की आय में 18000 रुपये का अंतर है, तो B की आय ज्ञात करें |02:52View Solution

