पांच कम्पनियो का पांच वर्षो में निर्यात तथा आयात का अनुपात।

सभी वर्षो में सभी कम्पनियो के लिए कितने बार निर्यात आयात से अधिक रहा है ?
आंकड़े अधूरे है
11
6
8
The correct Answer is:D
Step by step video & image solution for पांच कम्पनियो का पांच वर्षो में निर्यात तथा आयात का अनुपात। सभी वर्षो में सभी कम्पनियो के लिए कितने बार निर्यात आयात से अधिक रहा है ? by Maths experts to help you in doubts & scoring excellent marks in Class 14 exams.
Updated on:21/07/2023Topper's Solved these Questions
Similar Questions

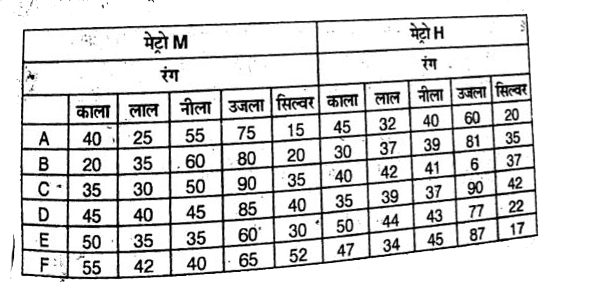
दोनों मेट्रो शहरो में किस नमूना के उजले रंग के कारो की बेचीं गयी संख्याओं में अंतर न्यूनतम है ?
View Solution400 रु. को राशि पर 5% वार्षिक दर से 73 दिनों का साधारण ब्याज क्या होगा ?
View SolutionWhich of the following are correct chain isomers of butane ? (i)
View SolutionDetermine the point of symmetry of a regular hexagon.
View SolutionDtermine the images of the following figure about the given line :
View SolutionMatch the following Column A to Column B

View SolutionMatch the following Column A to Column B

View SolutionMatch the following Column A to Column B

View SolutionThe inequation represented by the graph given below is :
View SolutionThe inequation that best describes the graph given below is _________
View SolutionThe inequation that best describes the following graph is _________
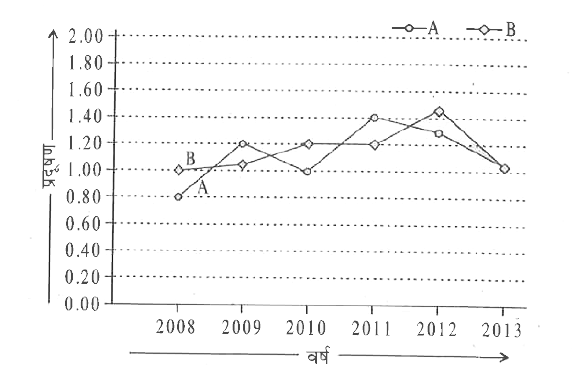
View Solutionनिचे दिये गये ग्राफ में दो प्रकार के वाहनों A व B के छ वर्षो के प्रदूषण का आंकड़ा दिया गया है ।A घरेलू वाहनों तथा B व्यावसायिक वाहनों को दर्शाता है ,तो ग्राफ का अध्ययन क्र आगे दिये गये प्रशनो के उत्तर दीजिए|
दिये गये वर्षो में से कितने वर्षो में B का प्रदूषण A के प्रदूषण से कम रहा है ?

View Solutionनिचे दिये गये ग्राफ में दो प्रकार के वाहनों A व B के छ वर्षो के प्रदूषण का आंकड़ा दिया गया है ।A घरेलू वाहनों तथा B व्यावसायिक वाहनों को दर्शाता है ,तो ग्राफ का अध्ययन क्र आगे दिये गये प्रशनो के उत्तर दीजिए|
दिये गये वर्षो में से कितने वर्षो में B का प्रदूषण A के प्रदूषण से कम रहा है ?

View SolutionThe given Bar Graph presents the Imports and Exports of an item (in tonnes) manufactured by a company for the five financial years, 2013-2014 to 2017-2018. दिया गया दंड आरेख पांच वित्तीय वर्षो अर्थत 2013-2014 से 2017-2018 तक एक कंपनी के द्वारा निर्मित किसी वस्तु के आयात और निर्यात ( टन में ) को दर्शाता है | What is the average of Exports (in tonnes) during the five financial years? पांच वित्तीय वर्षों के दौरान निर्यात (टन ) का औसत कया रहा है ?
View SolutionThe given Bar Graph presents the Imports and Exports of an item (in tonnes) manufactured by a company for the five financial years, 2013-2014 to 2017-2018. दिया गया दंड आरेख पांच वित्तीय वर्षो अर्थत 2013-2014 से 2017-2018 तक एक कंपनी के द्वारा निर्मित किसी वस्तु के आयात और निर्यात ( टन में ) को दर्शाता है | What is the average of total Import and Export (in tonnes) during the five financial year? पांच वित्तीय वर्षों के दौरान कुल आयात एवं निर्यात का औसत ( टन में)क्या है ?
View SolutionThe given Bar Graph presents the Imports and Exports of an item (in tonnes) manufactured by a company for the five financial years, 2013-2014 to 2017-2018. दिया गया दंड आरेख पांच वित्तीय वर्षो अर्थत 2013-2014 से 2017-2018 तक एक कंपनी के द्वारा निर्मित किसी वस्तु के आयात और निर्यात ( टन में ) को दर्शाता है | In which financial year the total of the Exports and Imports is the lowest? किस वित्तीय वर्ष में निर्यात तथा आयात का जोड़ सबसे कम है ?
View Solution
