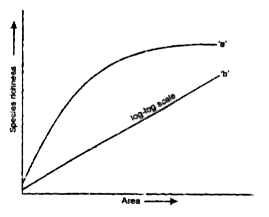
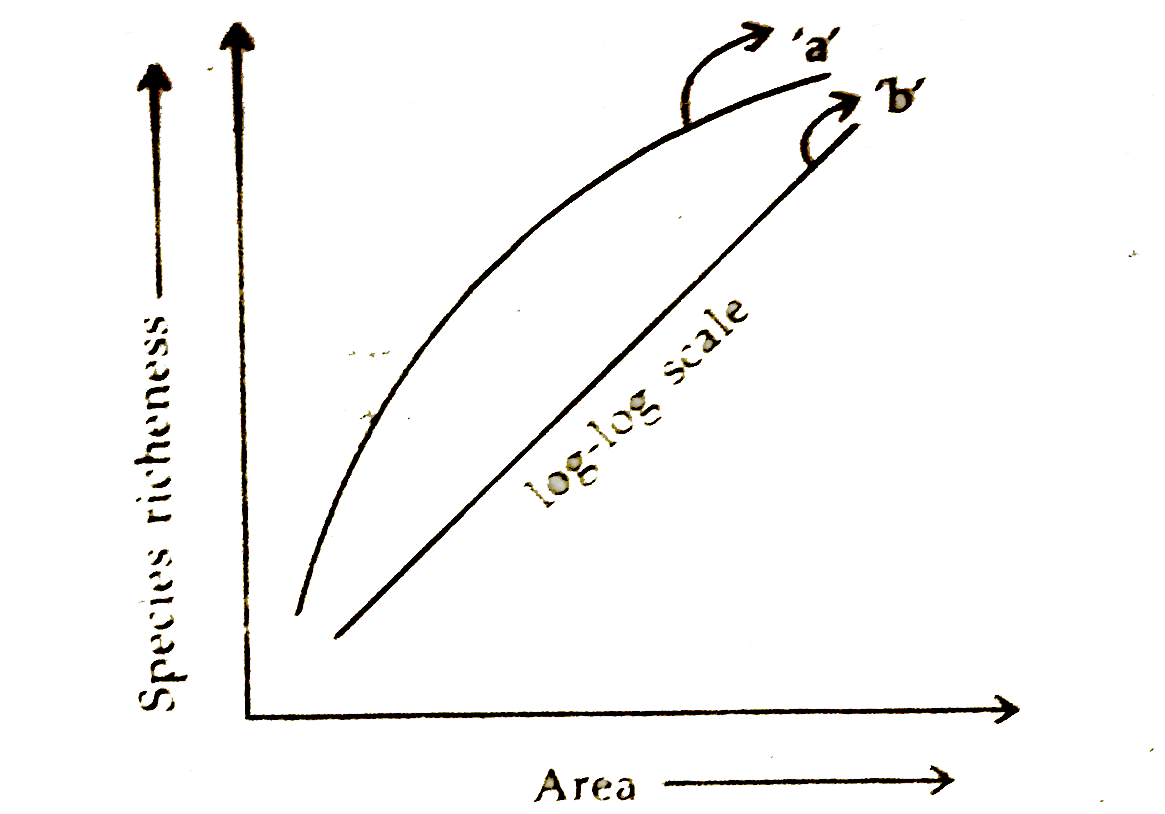
The following graph shows the species area relationship.Answer the following question as directed.
Write the situtions as discovered by the ecologists when the value of 'Z' (slope of the line ) lies
0.1 and 0.2 What does 'Z' stand for?

The slopes of regression lines are similar or has unaffected distribution in an area showns normal range.
Topper's Solved these Questions
- BOOK - BETTER CHOICE PUBLICATIONCHAPTER - BIODIVERSITY AND CONSERVATIONEXERCISE - LONG ANSWER TYPE QUESTIONS (5 MARKS)13videos
BIODIVERSITY AND CONSERVATION
- BOOK - BETTER CHOICE PUBLICATIONCHAPTER - BIODIVERSITY AND CONSERVATIONEXERCISE - LONG ANSWER TYPE QUESTIONS (MOST EXPECTED QUESTIONS 5 MARKS)9videos
BIODIVERSITY AND CONSERVATION
- BOOK - BETTER CHOICE PUBLICATIONCHAPTER - BIODIVERSITY AND CONSERVATIONEXERCISE - SHORT ANSWER TYPE QUESTIONS (3 MARKS)13videos
BIODIVERSITY AND CONSERVATION
- BOOK - BETTER CHOICE PUBLICATIONCHAPTER - BIOTECHNOLOGY AND ITS APPLICATIONSEXERCISE - LONG ANSWER TYPE QUESTIONS18videos
BIOTECHNOLOGY AND ITS APPLICATIONS
Similar Questions
The following graph shows the species area relationship. Answers the Questions as directed.
(a) Name the naturalist who studied the kind of relationship shown in the graph.
Write the observations made by him.
(b) Write the situations as discovered by the ecologists when the value of 'Z' (slope of the line) lies between
(i) 0.1 and 0.2, (ii) 0.6 and 1.2
What does 'Z' stand for ?
(c ) When would the slope of the line 'b' become steeper ?
 View Solution
The following graph shows the species area relationship. Answers the Questions as directed.
(a) Name the naturalist who studied the kind of relationship shown in the graph.
Write the observations made by him.
(b) Write the situations as discovered by the ecologists when the value of 'Z' (slope of the line) lies between
(i) 0.1 and 0.2, (ii) 0.6 and 1.2
What does 'Z' stand for ?
(c ) When would the slope of the line 'b' become steeper ?
 View Solution
Knowledge Check
- Question 1 - Select One
Consider the following question and decide which of the statements is sufficient to answer the question.
Question:
Find the value of m, slope of a line.
Statements:
1) y=mx+2
2) Line passes through (2, 1)AOnly statement 2 is sufficientBEither statement 1 or 2 is sufficientCOnly statement 1 is sufficientDBoth statements 1 and 2 are sufficient - Question 2 - Select One
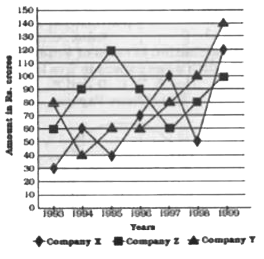
Study the following line graph and answer the questions.

In which year was the difference between the exports of companies Y and Z maximum ?A1994B1997C1995D1996 - Question 3 - Select One
Assertion : If the species-area relationship are analysed among very large areas like the entire continents, the value of Z, i.e., slope of line in the range of 0.1 to 0.2.
Reason : The value of Z, i.e., slope of line of species area relationship lies in the range of 0.6 to 1.2 when analysis is done among small areas.AIf both assertion and reason are true and reason is the correct explanation of assertion.BIf both assertion and reason are true but reason is not the correct explanation of assertion.CIf assertion is true but reason is false.DIf both assertion and reason are false.
The following graph shows the species area relationship. Answers the Questions as directed.
(a) Name the naturalist who studied the kind of relationship shown in the graph.
Write the observations made by him.
(b) Write the situations as discovered by the ecologists when the value of 'Z' (slope of the line) lies between
(i) 0.1 and 0.2, (ii) 0.6 and 1.2
What does 'Z' stand for ?
(c ) When would the slope of the line 'b' become steeper ?
 View Solution
The following table shows the electronic configuration of the elements W, X, Y, Z:

Answer the following questions based on the table above :
What is the formula of the compound formed between :
1. X and Z 2 . W and XView SolutionAnswer the following questions briefly:
What percentage of the cropped area is under cereals? Where does India stand in the world?View SolutionThe following table shows the electronic configuration of the elements W, X, Y, Z:

Answer the following questions based on the table above :
What type of Bond is formed between :
1. Wand X 2. Y and ZView SolutionAssertion : If the species-area relationship are analysed among very large areas like the entire continents, the value of Z, i.e., slope of line in the range of 0.1 to 0.2.
Reason : The value of Z, i.e., slope of line of species area relationship lies in the range of 0.6 to 1.2 when analysis is done among small areas.View Solution

