The diagram given here is the standard ECG of a normal person.The P-wave represents the
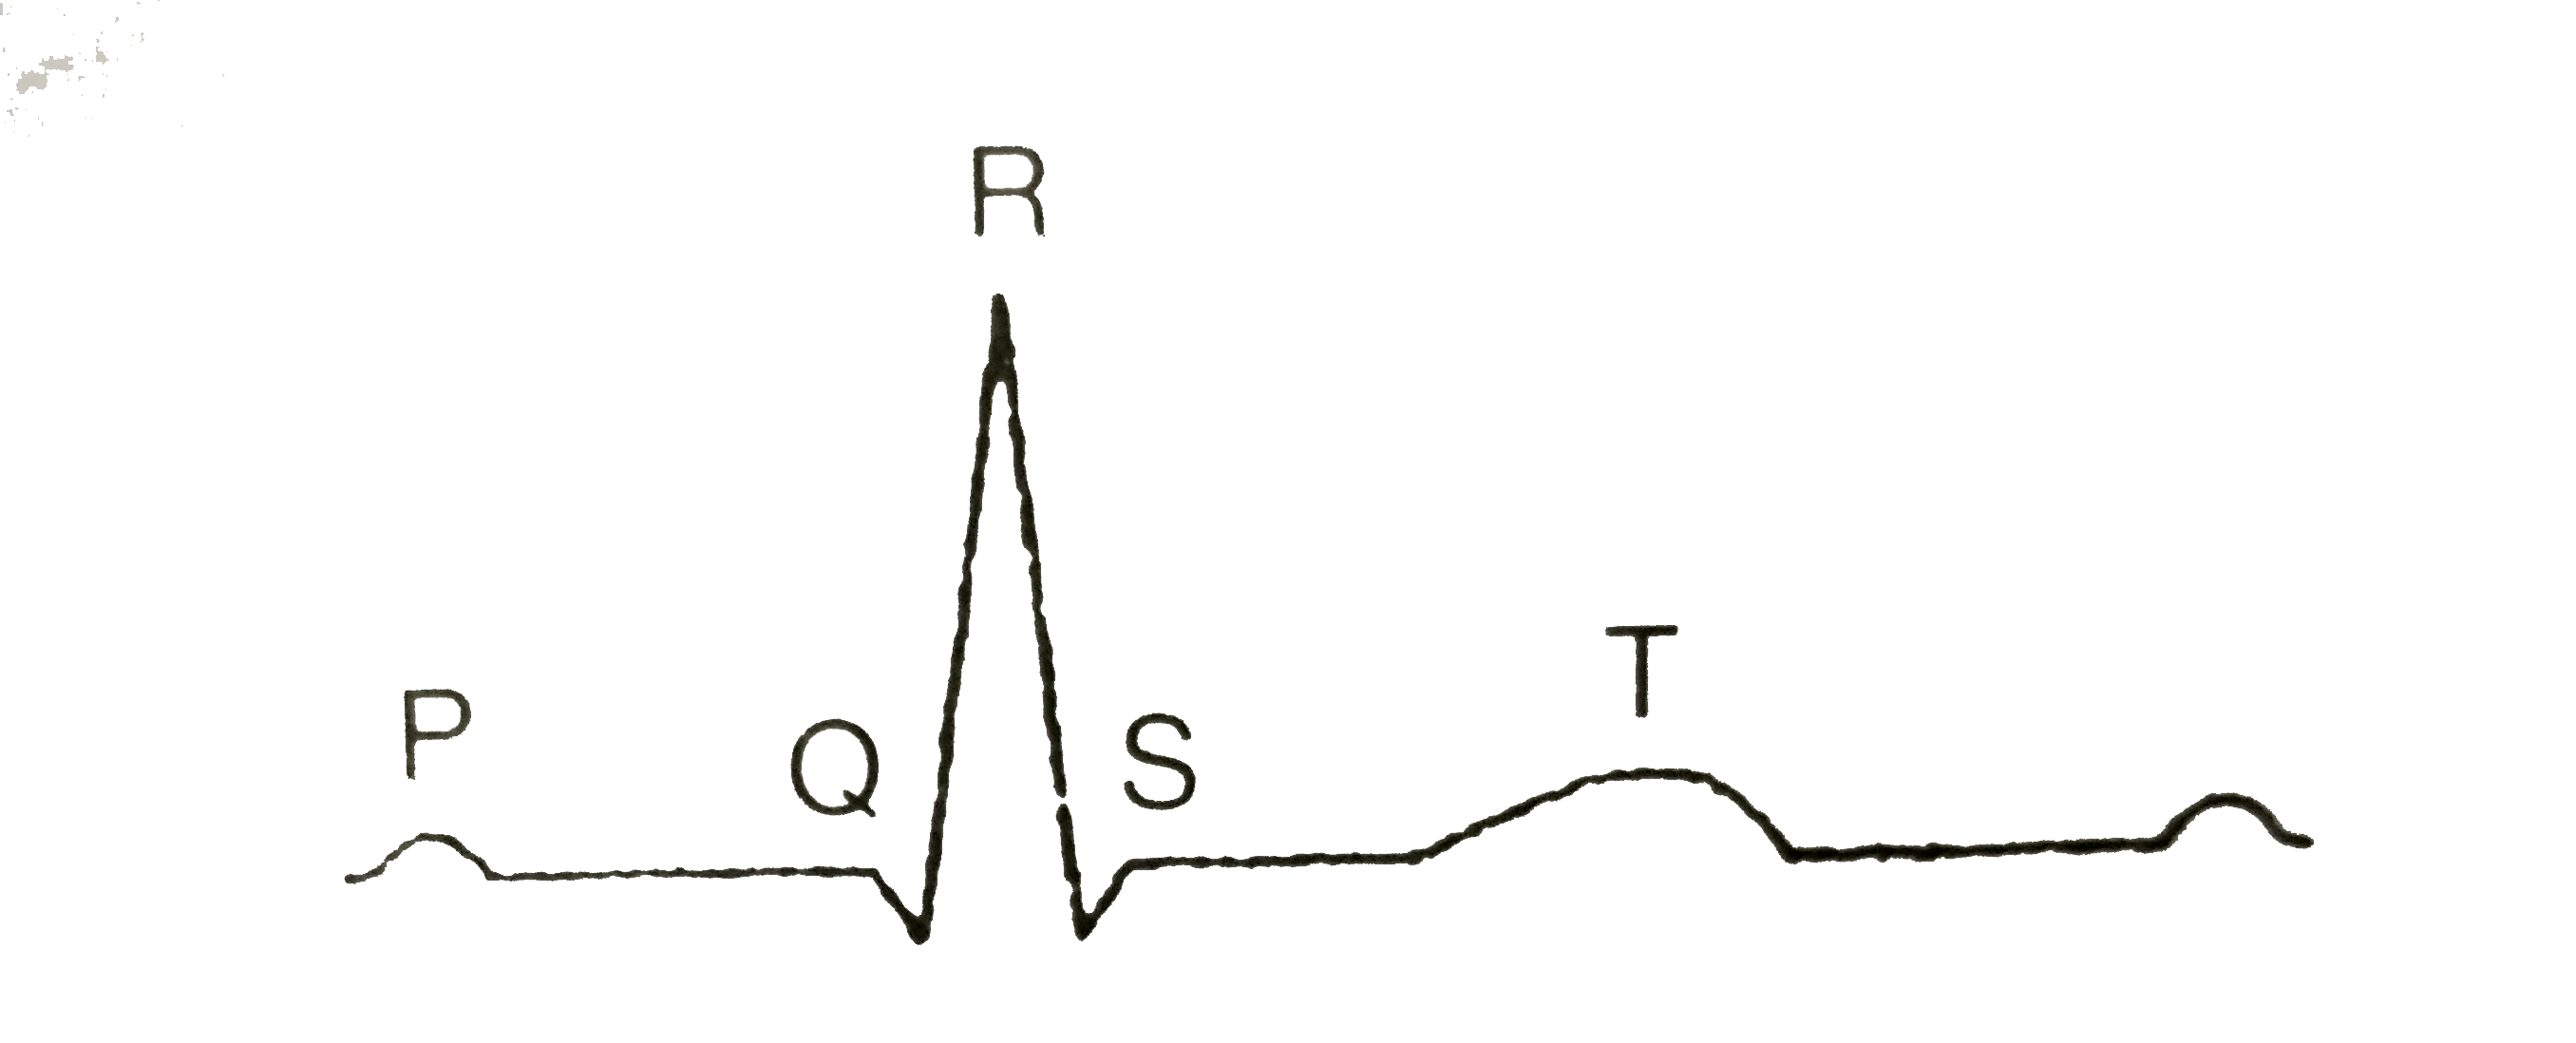
A
End of systole
B
Contraction of both the atria
C
Initiation of the ventricular contraction
D
Beginning of the charcters.
Video Solution
Text Solution
The correct Answer is:B
|
Answer
Step by step video & image solution for The diagram given here is the standard ECG of a normal person.The P-wave represents the by Biology experts to help you in doubts & scoring excellent marks in Class 12 exams.
Updated on:21/07/2023Topper's Solved these Questions
- BIOLOGY IN HUMAN WELFARE (HEALTH & DISEASES) BOOK - ALLENCHAPTER - BIOLOGY IN HUMAN WELFARE (HEALTH & DISEASES) EXERCISE - Exercise -III
20 Videos
- BIOLOGY IN HUMAN WELFARE (HEALTH & DISEASES) BOOK - ALLENCHAPTER - BIOLOGY IN HUMAN WELFARE (HEALTH & DISEASES) EXERCISE - Exercise -IV Assertion : Reason
20 Videos
- BIOLOGY IN HUMAN WELFARE (HEALTH & DISEASES) BOOK - ALLENCHAPTER - BIOLOGY IN HUMAN WELFARE (HEALTH & DISEASES) EXERCISE - Exercise -I
59 Videos
- BIOLOGY IN HUMAN WELFARE (DOMESTICATION OF PLANTS & ANIMALS) BOOK - ALLENCHAPTER - BIOLOGY IN HUMAN WELFARE (DOMESTICATION OF PLANTS & ANIMALS) EXERCISE - Exercise-IV (Assertion & Reason)
8 Videos
- BIOMOLECULE - IBOOK - ALLENCHAPTER - BIOMOLECULE - IEXERCISE - S
20 Videos
Similar Questions
Knowledge Check
The diagram given here is the representation of
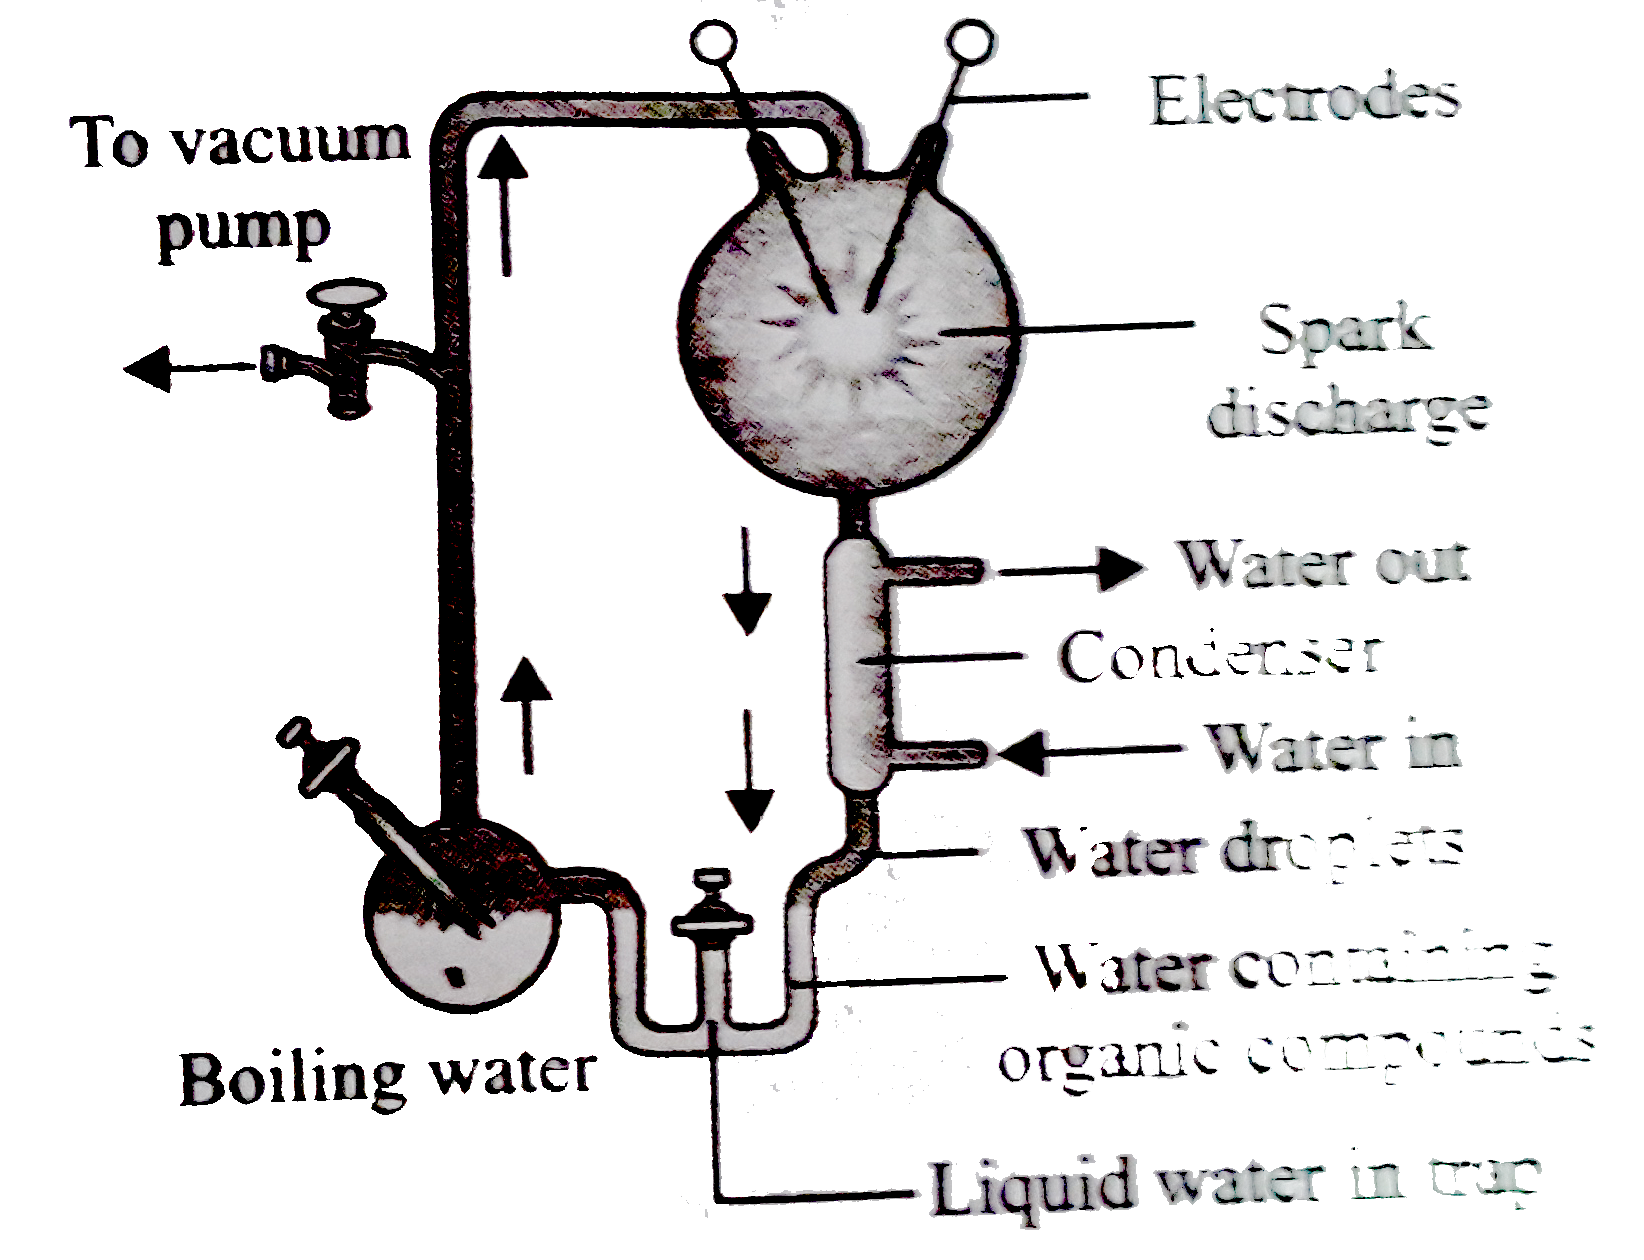 AMiller's experimentBRedi's experimentCLouis pasteur's experimentDSpallanzani's experiment
Study the diagram given below and answer the questions that follow:
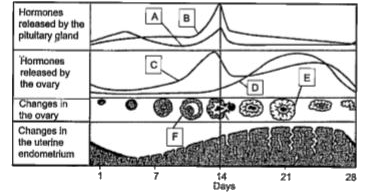
The alphabet 'A' represents ______ hormone.AOestrogenBProgesteroneCFSHDLH
The diagram given below represents
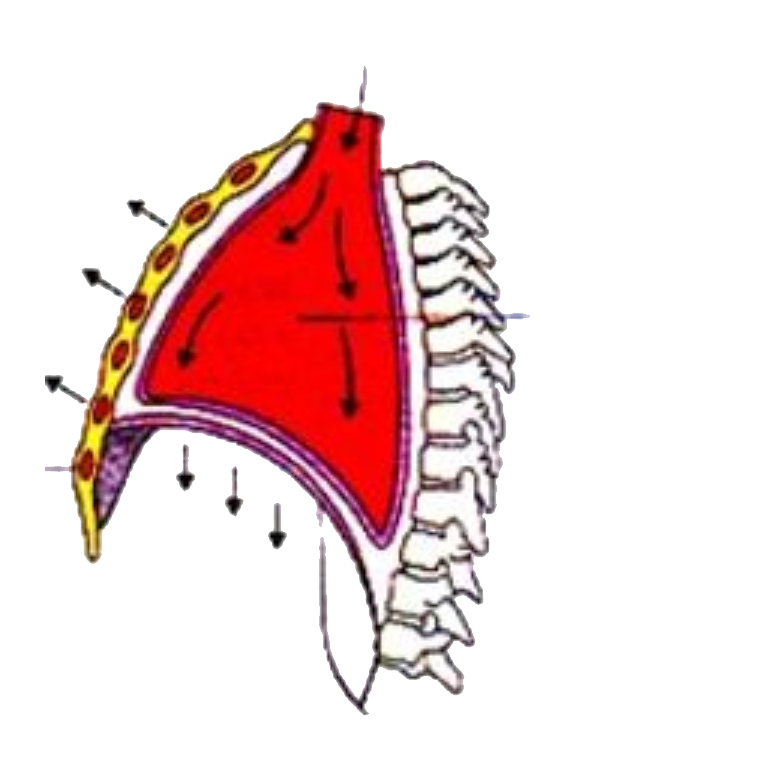
View SolutionThe given diagram represents
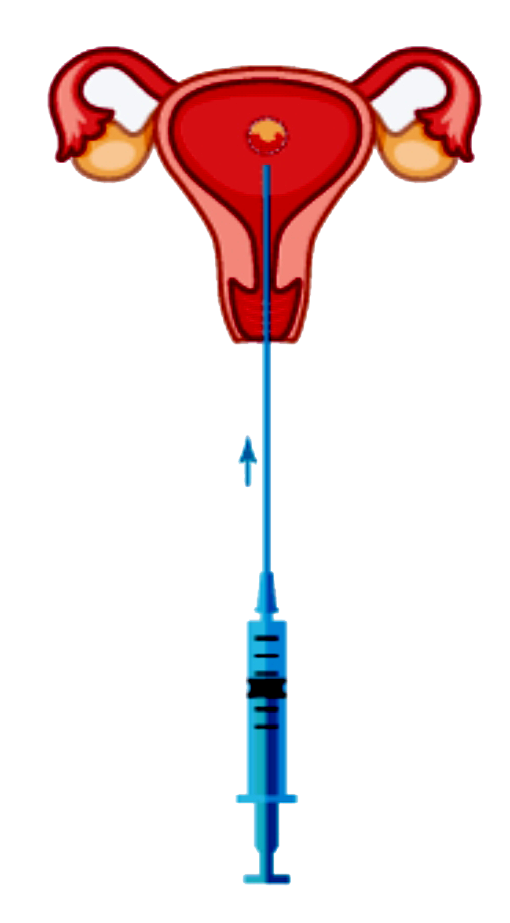
View SolutionIn ECG, what does T wave represent?
View Solution'T' wave in an ECG represents
View SolutionT wave in a standard ECG represents
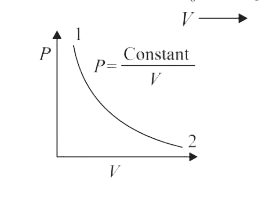
View SolutionFor the diagram given for an ideal gas, out of the following which one correctly represent the diagram?
View Solution

