Which one of the following diagrams represent the placentation in Dianthus?
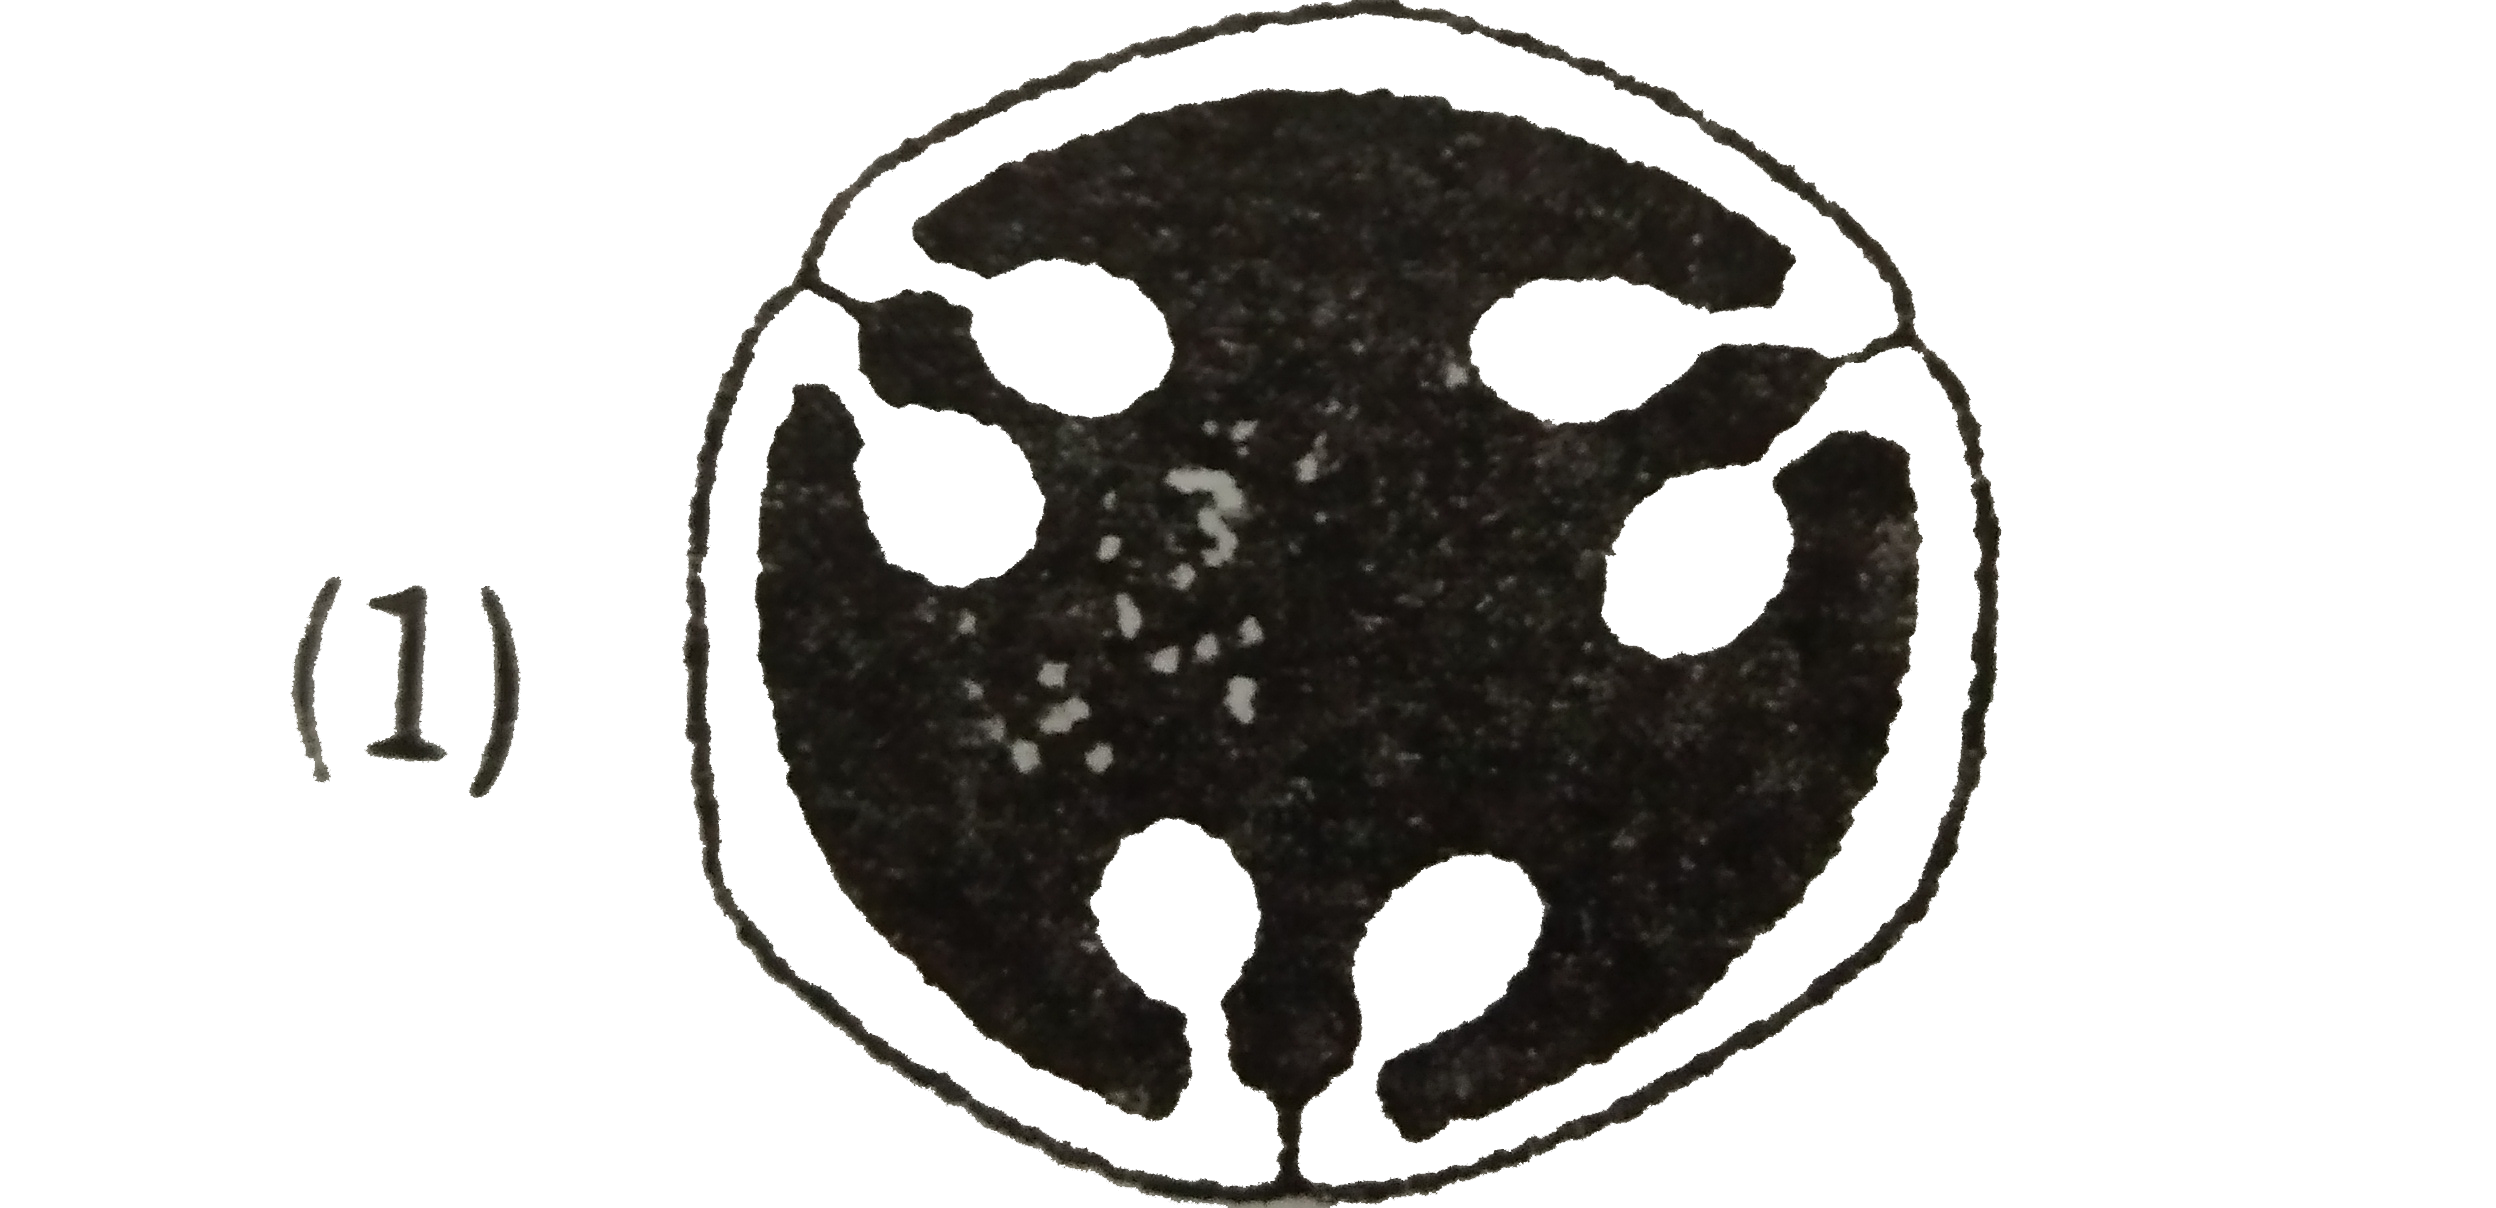
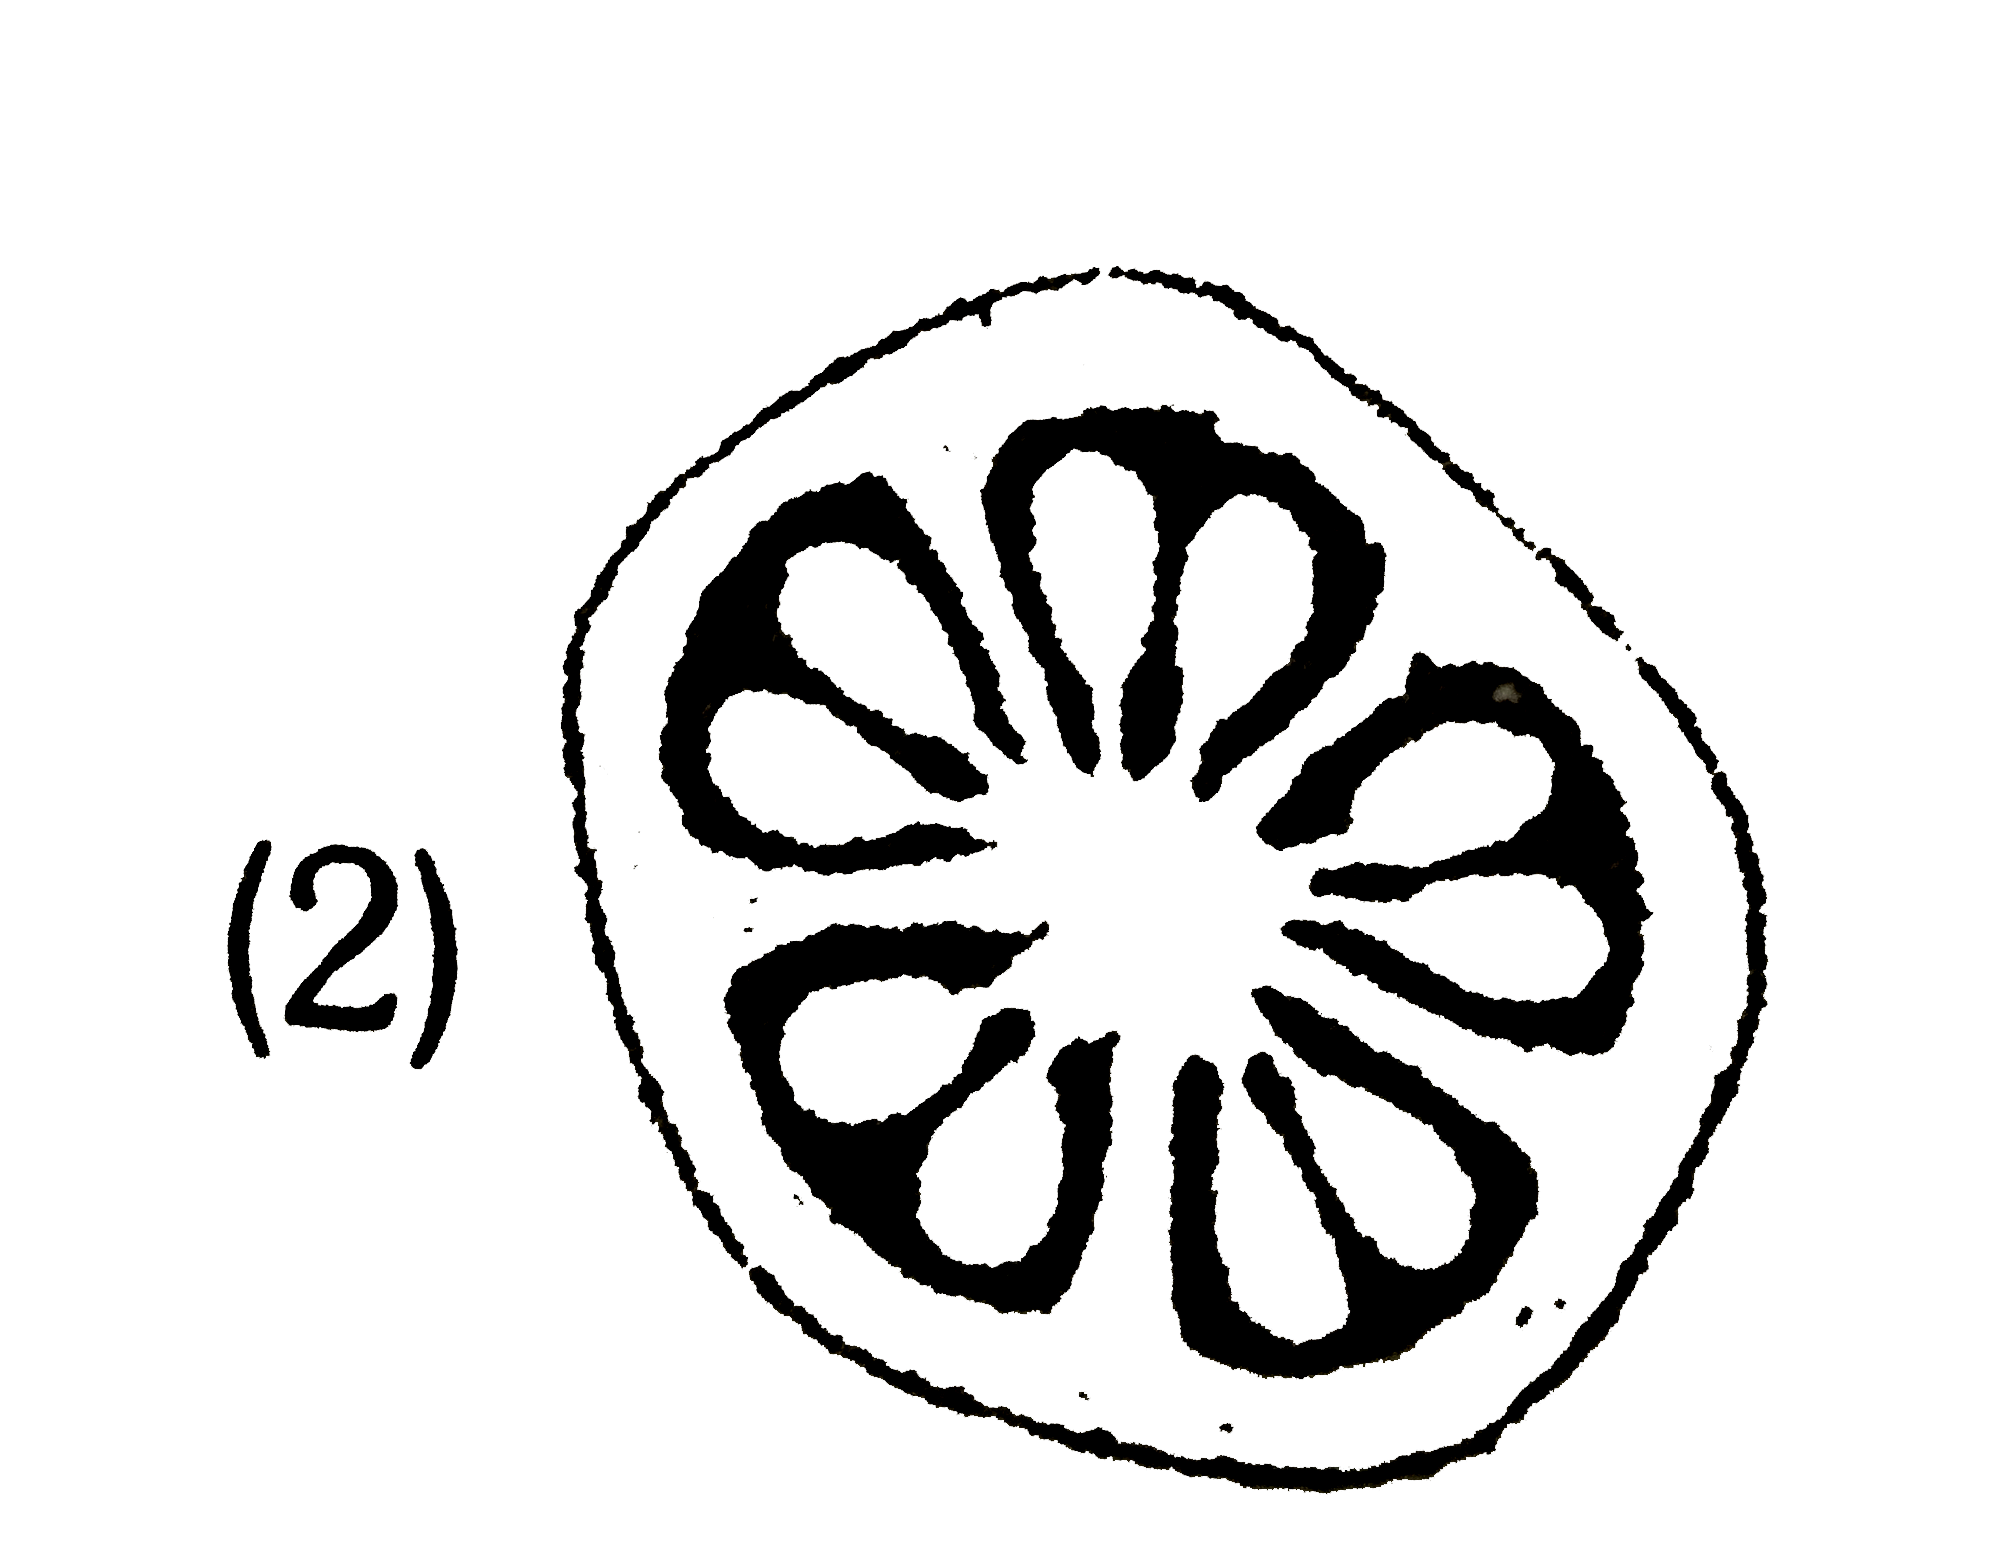
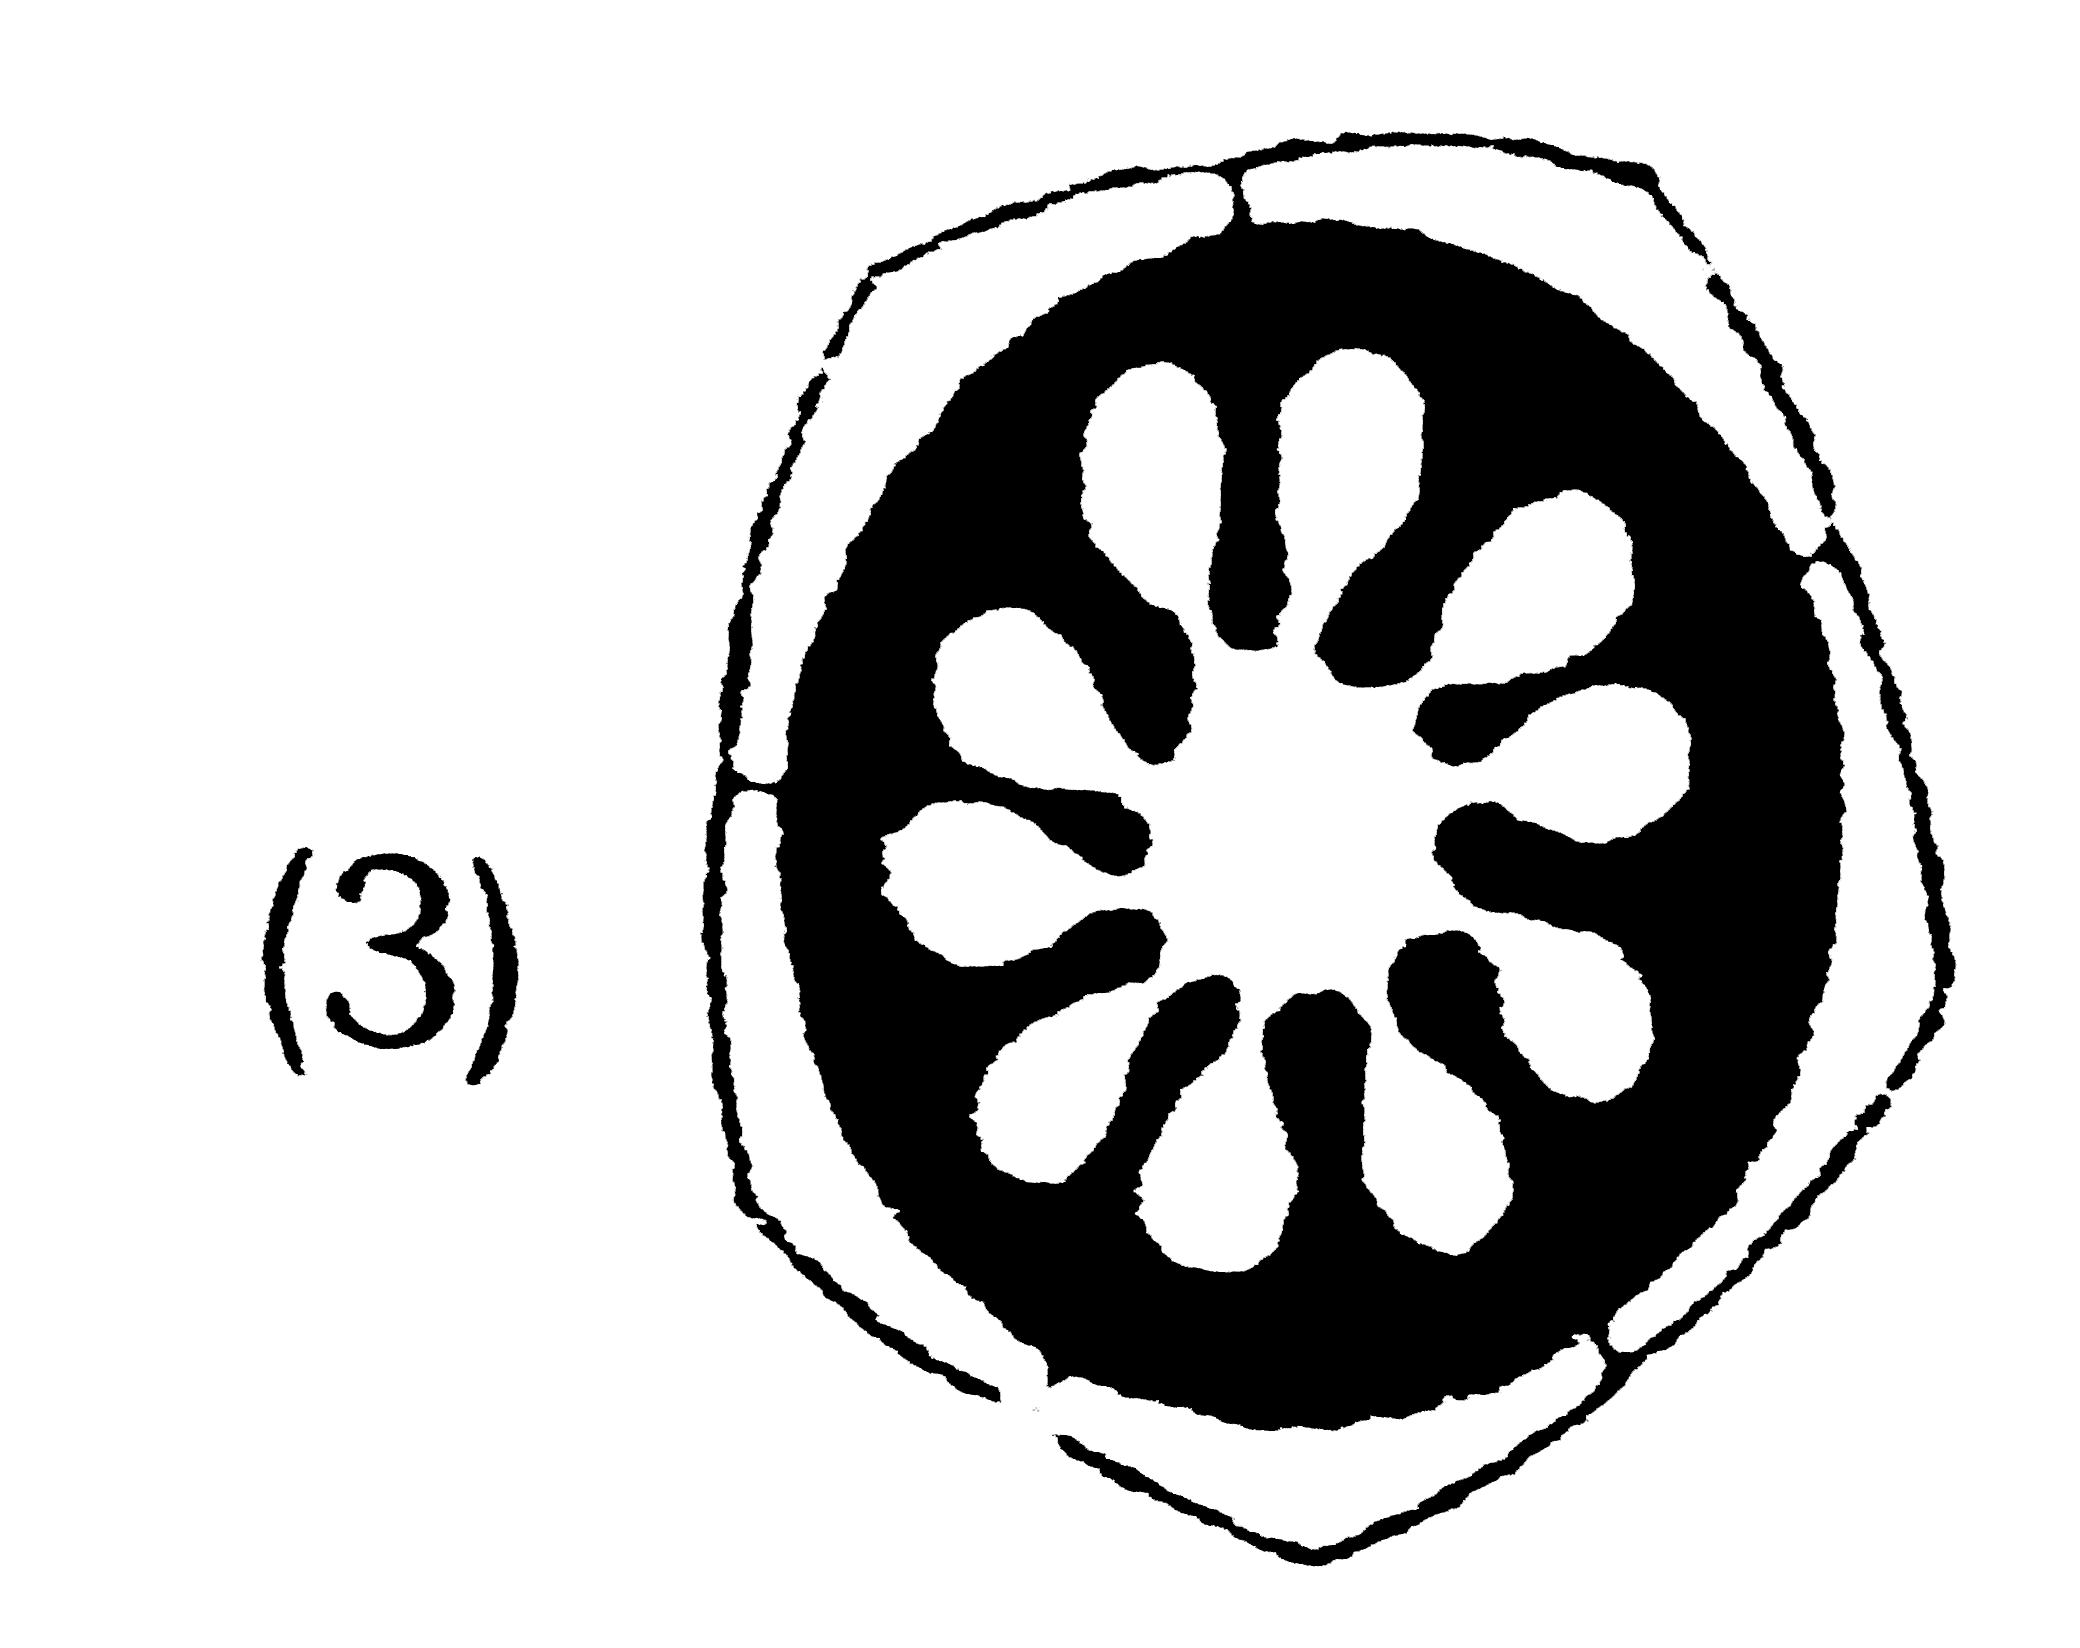
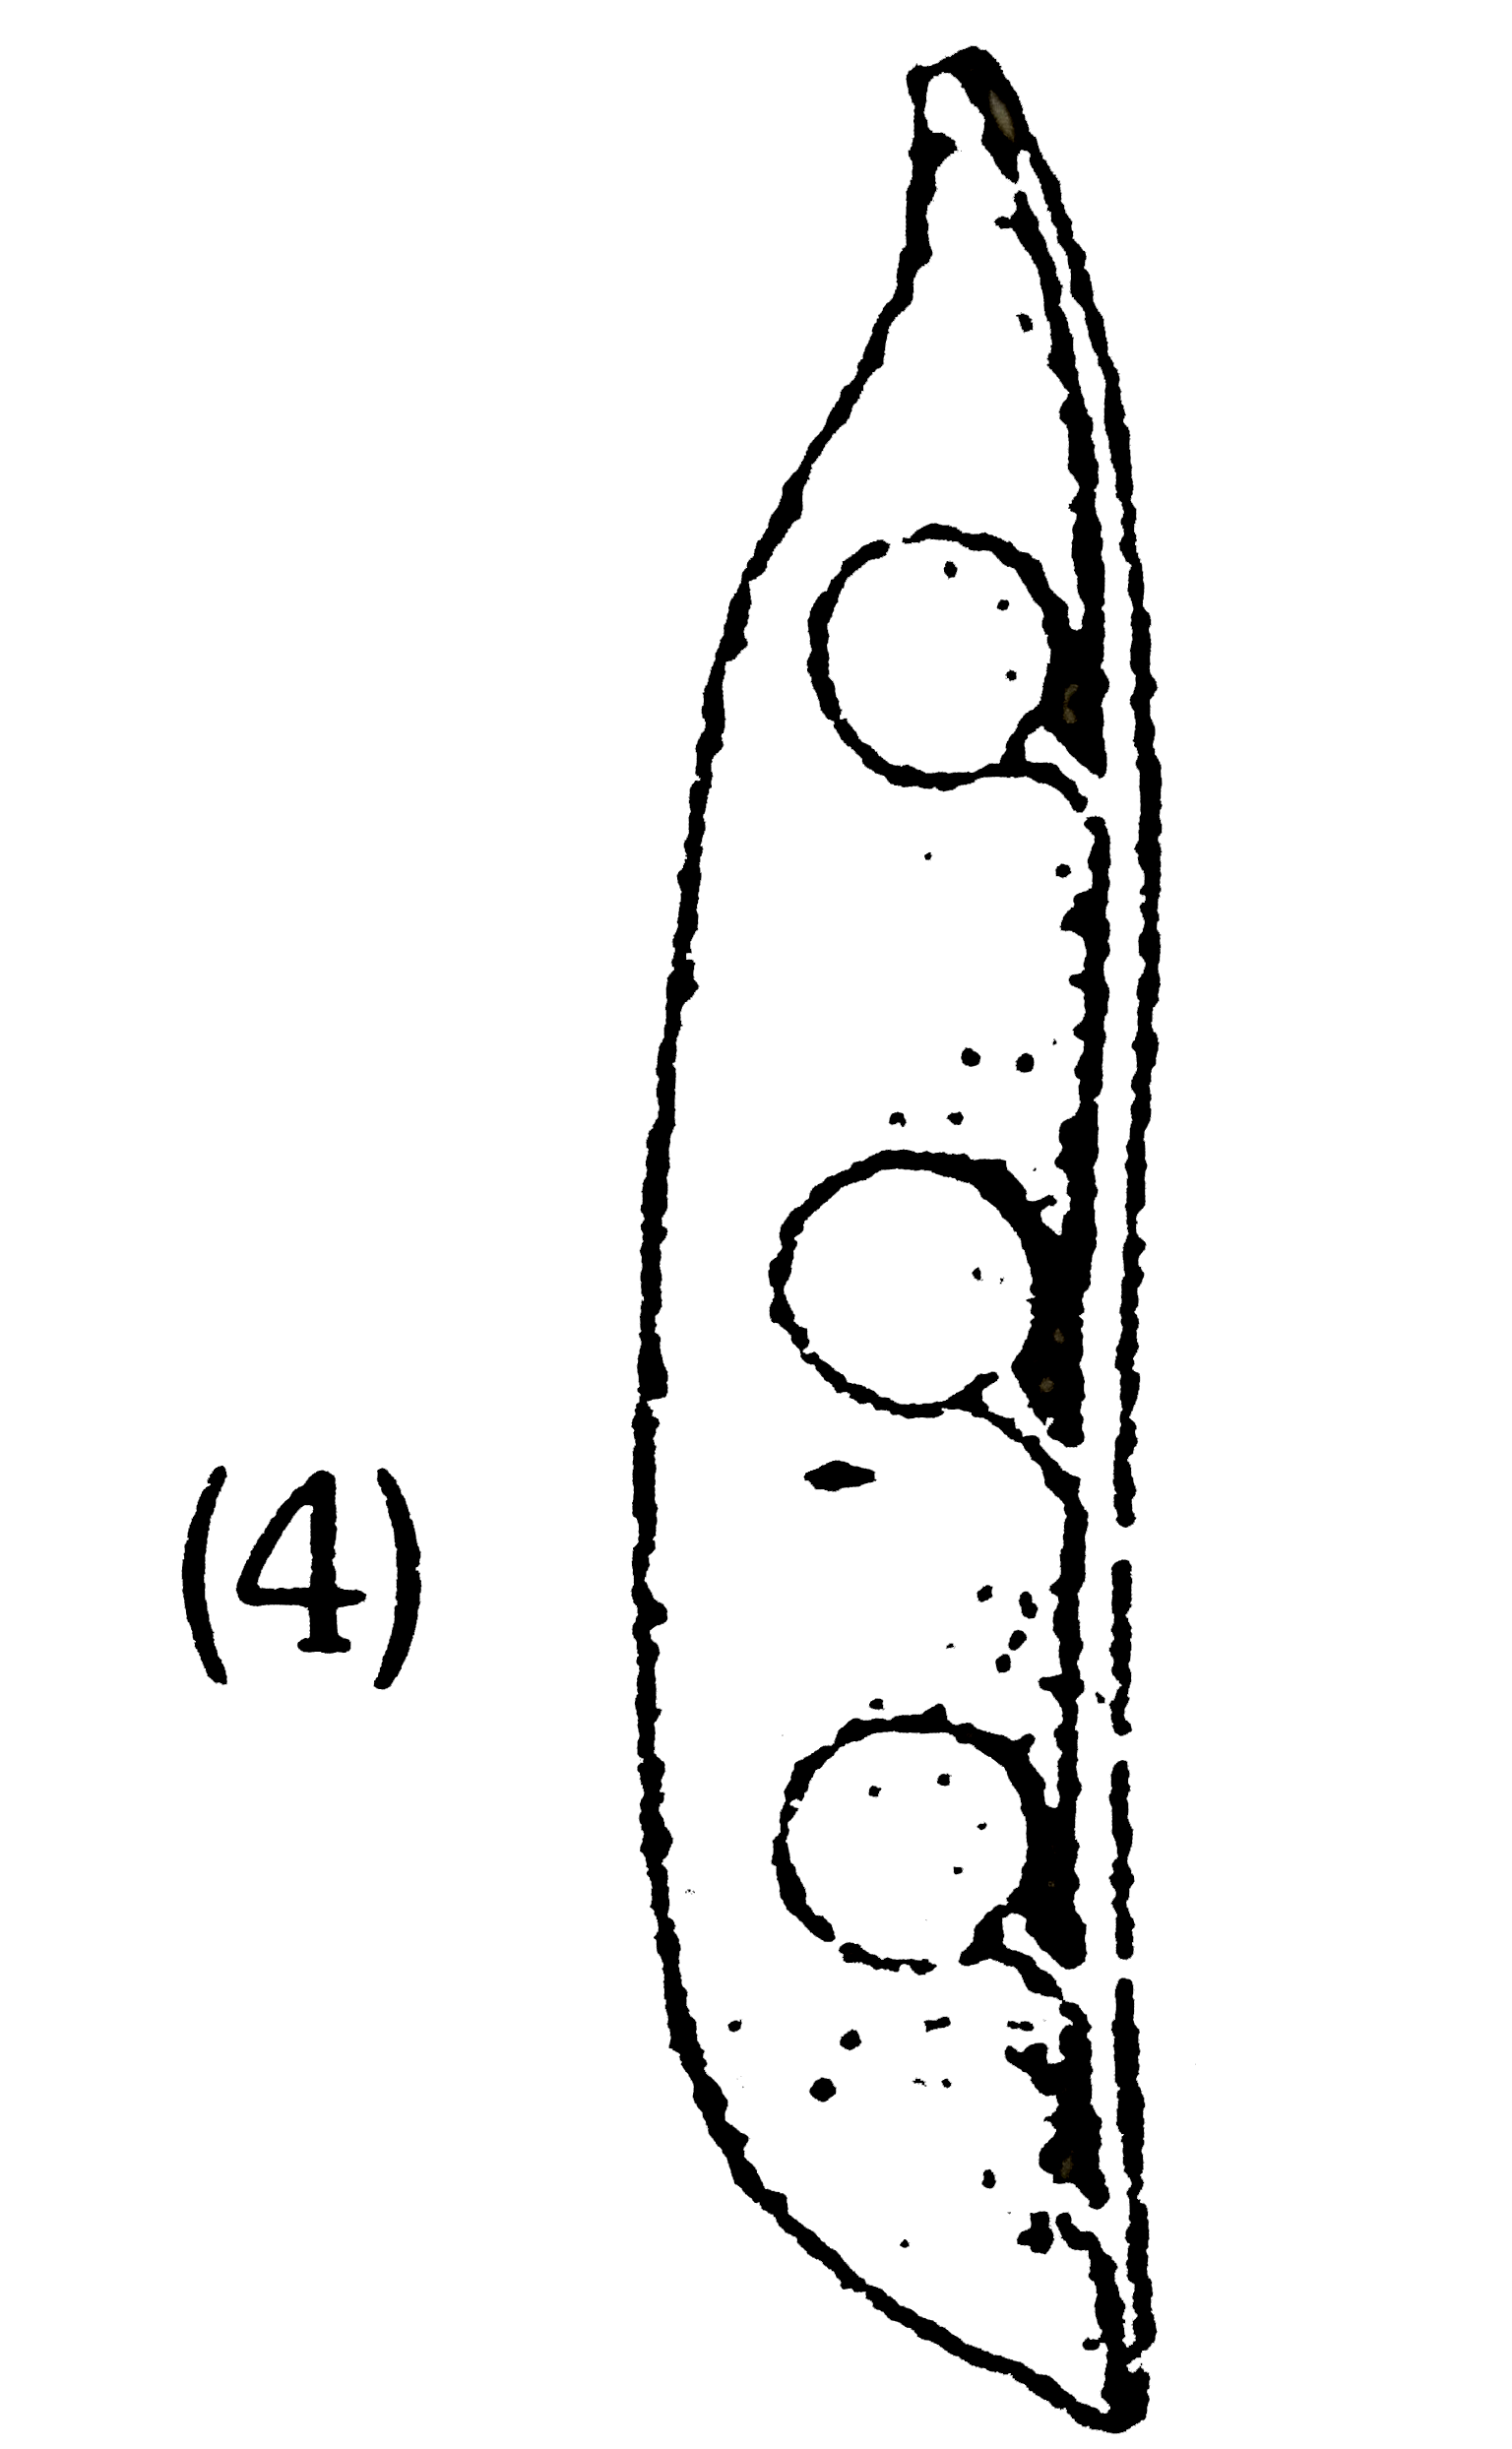
The correct Answer is:C
Step by step video & image solution for Which one of the following diagrams represent the placentation in Dianthus? by Biology experts to help you in doubts & scoring excellent marks in Class 12 exams.
Updated on:21/07/2023Topper's Solved these Questions
- STRUCTURAL ORGANISATION IN PLANTS (MOPRHOLOGY OF FLOWERING PLANTS & ANATOMY OF FLOWERING PLANTS)BOOK - ALLENCHAPTER - STRUCTURAL ORGANISATION IN PLANTS (MOPRHOLOGY OF FLOWERING PLANTS & ANATOMY OF FLOWERING PLANTS)EXERCISE - AIMS 2001
1 Videos
- STRUCTURAL ORGANISATION IN PLANTS (MOPRHOLOGY OF FLOWERING PLANTS & ANATOMY OF FLOWERING PLANTS)BOOK - ALLENCHAPTER - STRUCTURAL ORGANISATION IN PLANTS (MOPRHOLOGY OF FLOWERING PLANTS & ANATOMY OF FLOWERING PLANTS)EXERCISE - AIPMT-Pre 2012
12 Videos
- STRUCTURAL ORGANISATION IN PLANTS (MOPRHOLOGY OF FLOWERING PLANTS & ANATOMY OF FLOWERING PLANTS)BOOK - ALLENCHAPTER - STRUCTURAL ORGANISATION IN PLANTS (MOPRHOLOGY OF FLOWERING PLANTS & ANATOMY OF FLOWERING PLANTS)EXERCISE - AIPMT-Pre 2011
8 Videos
- STRATEGIES FOR ENHANCEMENT IN FOOD PRODUCTION & ANIMAL HUSBANDRYBOOK - ALLENCHAPTER - STRATEGIES FOR ENHANCEMENT IN FOOD PRODUCTION & ANIMAL HUSBANDRYEXERCISE - Question
47 Videos
- STRUCTURAL ORGANISATION OF ANIMALS (ANIMALTISSUE)BOOK - ALLENCHAPTER - STRUCTURAL ORGANISATION OF ANIMALS (ANIMALTISSUE)EXERCISE - S
32 Videos
Similar Questions
Knowledge Check
Ellingham diagram represents:
AΔG with temperatureBΔH with temperatureCΔH with pressureD(ΔG−TΔS) with temperature
Which of the following diagram represents axile placentation?
View SolutionWhat does the following diagram represent ?
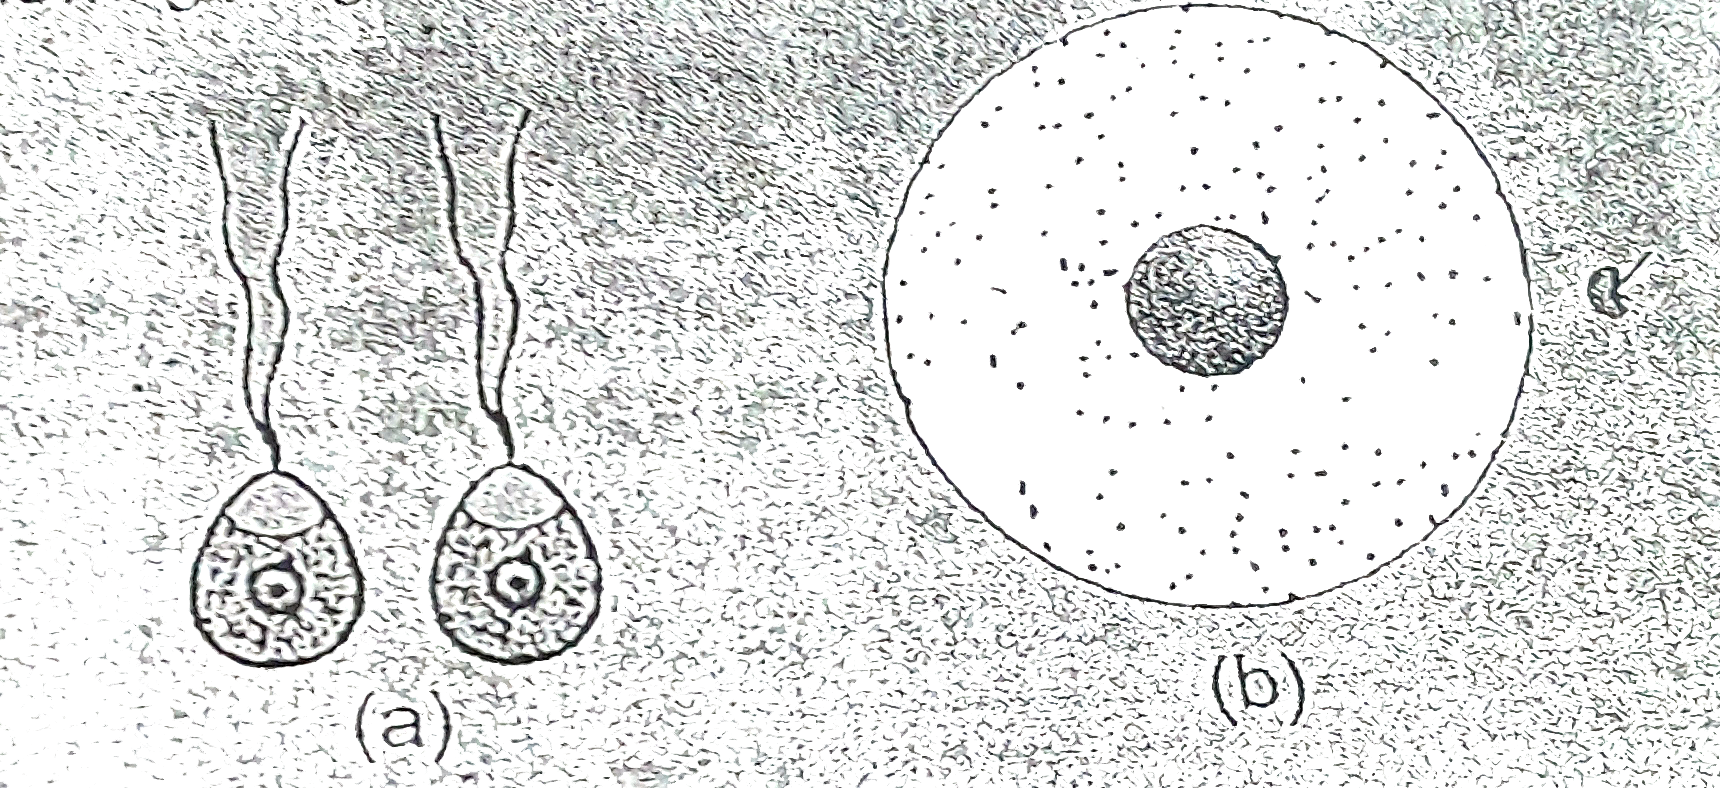
View SolutionWhich one of the following figures represents the placentation on primrose ?
View SolutionWhich one of the following represents a wave ?
View SolutionWhich of the following Venn diagram represent (A−B)?
View SolutionA metallic shell has a point charge 'q' kept inisde its cavity. Which one of the following diagrams correctly represents the electric lines of forces?
View SolutionWhich one of the following diagrams represents the most common relationships between temperature and enzyme activity, when the temperature is raised gradually from 0- 80∘ C?
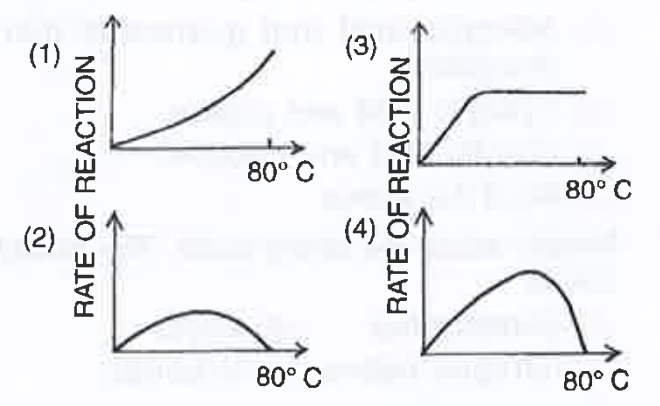
View Solution
