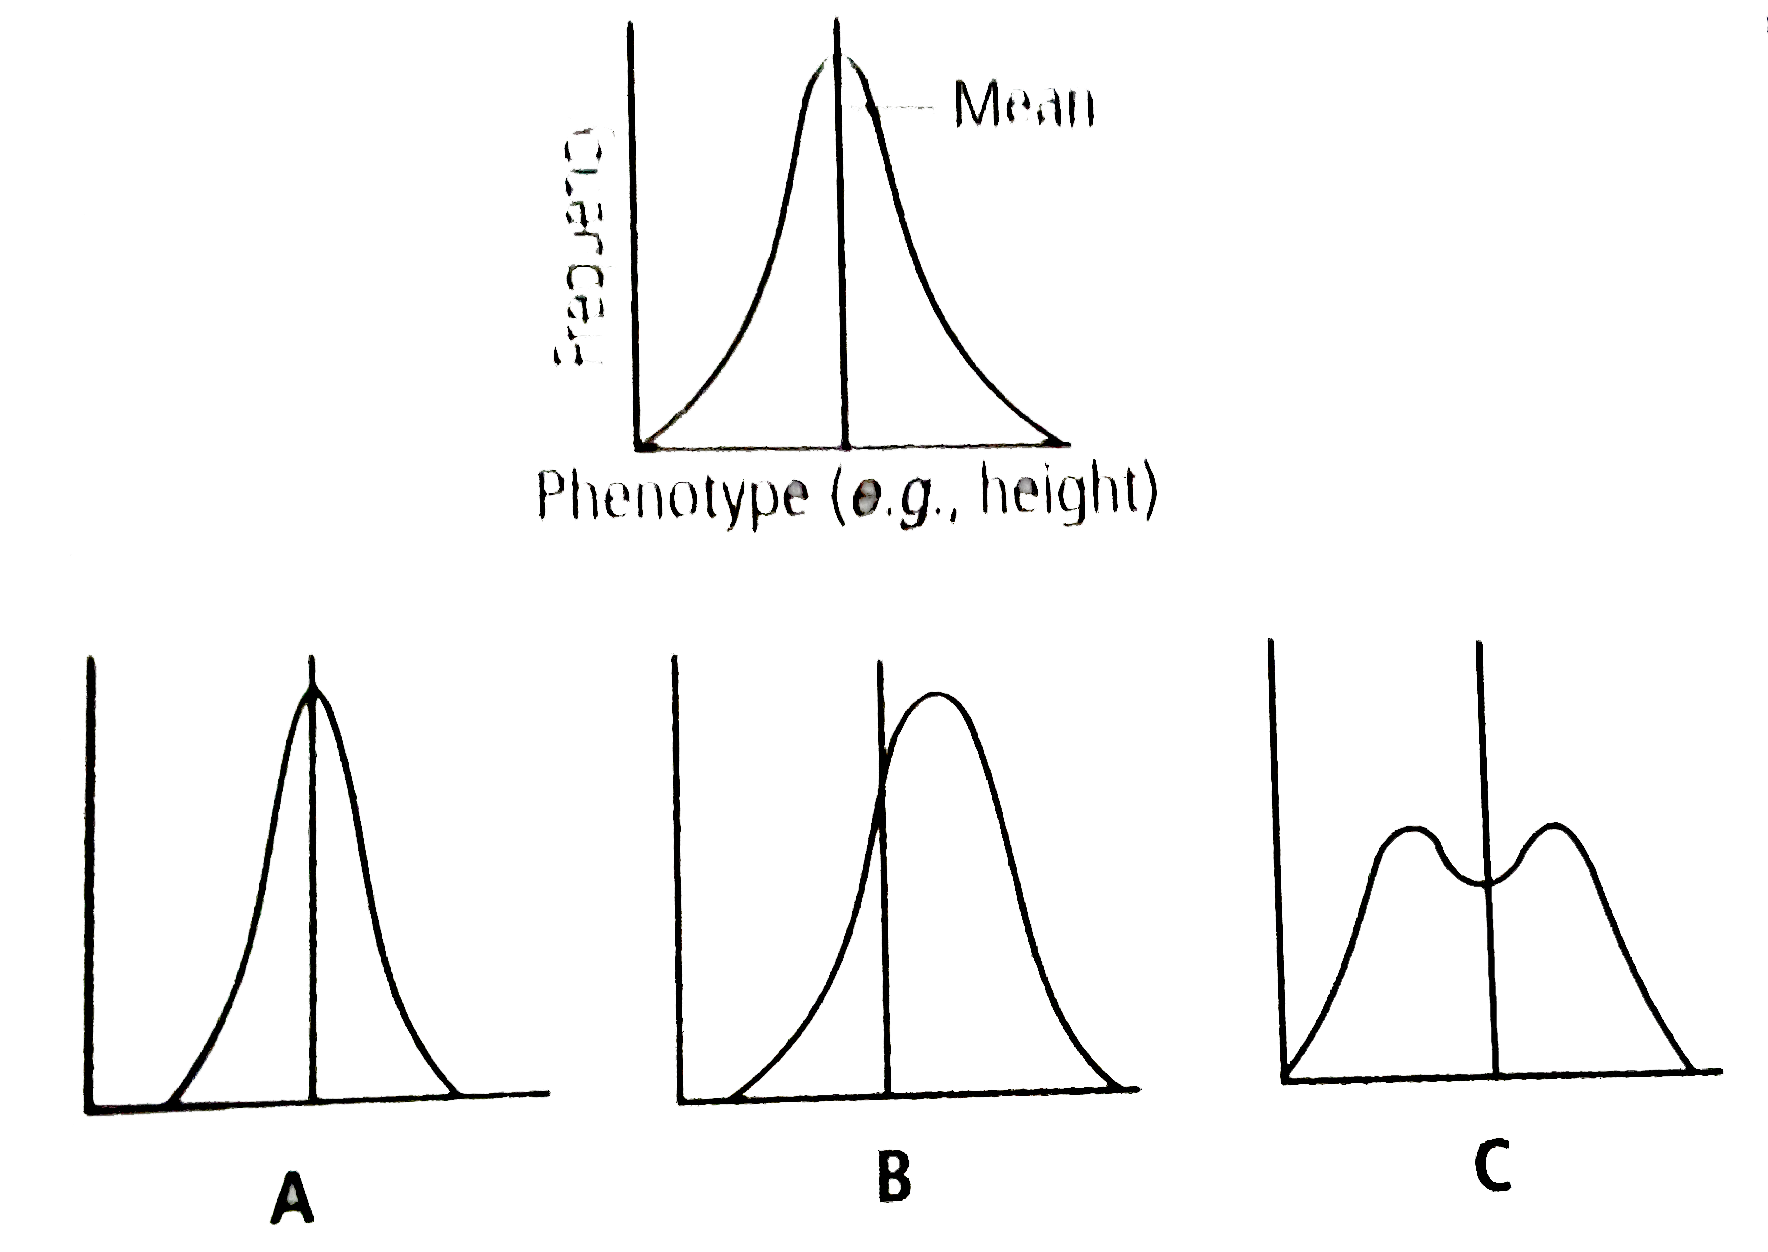
Draw graph for three types of natural selection.
To draw the graphs for the three types of natural selection, follow these steps:
1. Set Up the Axes:
- Draw a horizontal line (x-axis) and label it "Size of the Organisms".
- Draw a vertical line (y-axis) and label it "Number of Individuals".
2. Graph for Stabilizing Selection:
- In the middle of the x-axis, draw a bell-shaped curve that peaks at the center.
- This curve should be symmetrical, indicating that the majority of individuals are of medium size, while very few are of extreme small or large sizes.
- Label this curve as "Stabilizing Selection".
3. Graph for Directional Selection:
- Draw a curve that peaks at one end of the x-axis, either at the left (small size) or the right (large size).
- This curve should slope downwards towards the opposite end, indicating that individuals are favoring one extreme size over the other.
- Label this curve as "Directional Selection".
4. Graph for Disruptive Selection:
- Draw two peaks on the x-axis, one on the left (small size) and one on the right (large size), with a trough in the middle.
- This indicates that individuals are favoring both extremes of size, while the medium size is less favored.
- Label this curve as "Disruptive Selection".
Final Graphs:
- You should now have three distinct curves on the same graph, each representing a different type of natural selection.
- Draw a horizontal line (x-axis) and label it "Size of the Organisms".
- Draw a vertical line (y-axis) and label it "Number of Individuals".
- In the middle of the x-axis, draw a bell-shaped curve that peaks at the center.
- This curve should be symmetrical, indicating that the majority of individuals are of medium size, while very few are of extreme small or large sizes.
- Label this curve as "Stabilizing Selection".
- Draw a curve that peaks at one end of the x-axis, either at the left (small size) or the right (large size).
- This curve should slope downwards towards the opposite end, indicating that individuals are favoring one extreme size over the other.
- Label this curve as "Directional Selection".
- Draw two peaks on the x-axis, one on the left (small size) and one on the right (large size), with a trough in the middle.
- This indicates that individuals are favoring both extremes of size, while the medium size is less favored.
- Label this curve as "Disruptive Selection".
- You should now have three distinct curves on the same graph, each representing a different type of natural selection.
Topper's Solved these Questions
Similar Questions
Knowledge Check
Following is the digrammatic representation of the operation of natural selection on different traits. Which of the following options correctly identifies all the three graphs A,B and C?
 AABCDirectionalStabilisingDisruptiveBABCStabilisingDirectionalDisruptiveCABCDistruptiveStatbilisingDirectionalDABCDirectionalDisruptiveStabilising
(a) State Hardy Weinberg principle. Name any two factors which affect it.
(b) Draw a graph to show that natural selection leads to directional change.
View SolutionDraw graph for y=|x−1|.
View SolutionDescribe different types of natural selection with the help of graphs.
View Solutiondraw graph of y=2x
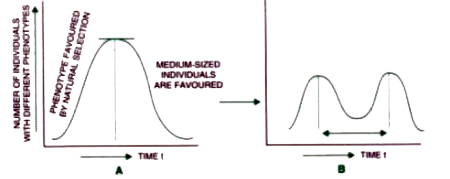
View SolutionStudy the figures (A) and (B) given below and answer the questions that follow:

Under the influence of which type of Natural Selection would graph (A) become like graph (B)?
View SolutionDraw the graph of y=|x|
View SolutionDraw the graph of y=2x.
View Solution
