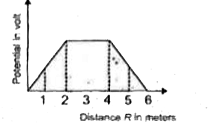
The variation of potential with distance r from a fixed point is shown in figure. The electric field at r = 5m is:
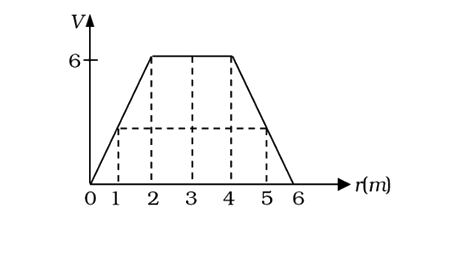
(2.5)V/cm
(−2.5)V/cm
(−2/5)V/cm
(2/5)V/cm
The correct Answer is:A
Step by step video & image solution for The variation of potential with distance r from a fixed point is shown in figure. The electric field at r = 5m is: by Physics experts to help you in doubts & scoring excellent marks in Class 12 exams.
Updated on:21/07/2023Topper's Solved these Questions
Similar Questions
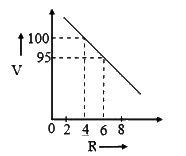
The variation of potential with distance R from a fixed point is shown in figure. The electric field at R = 5 m is -
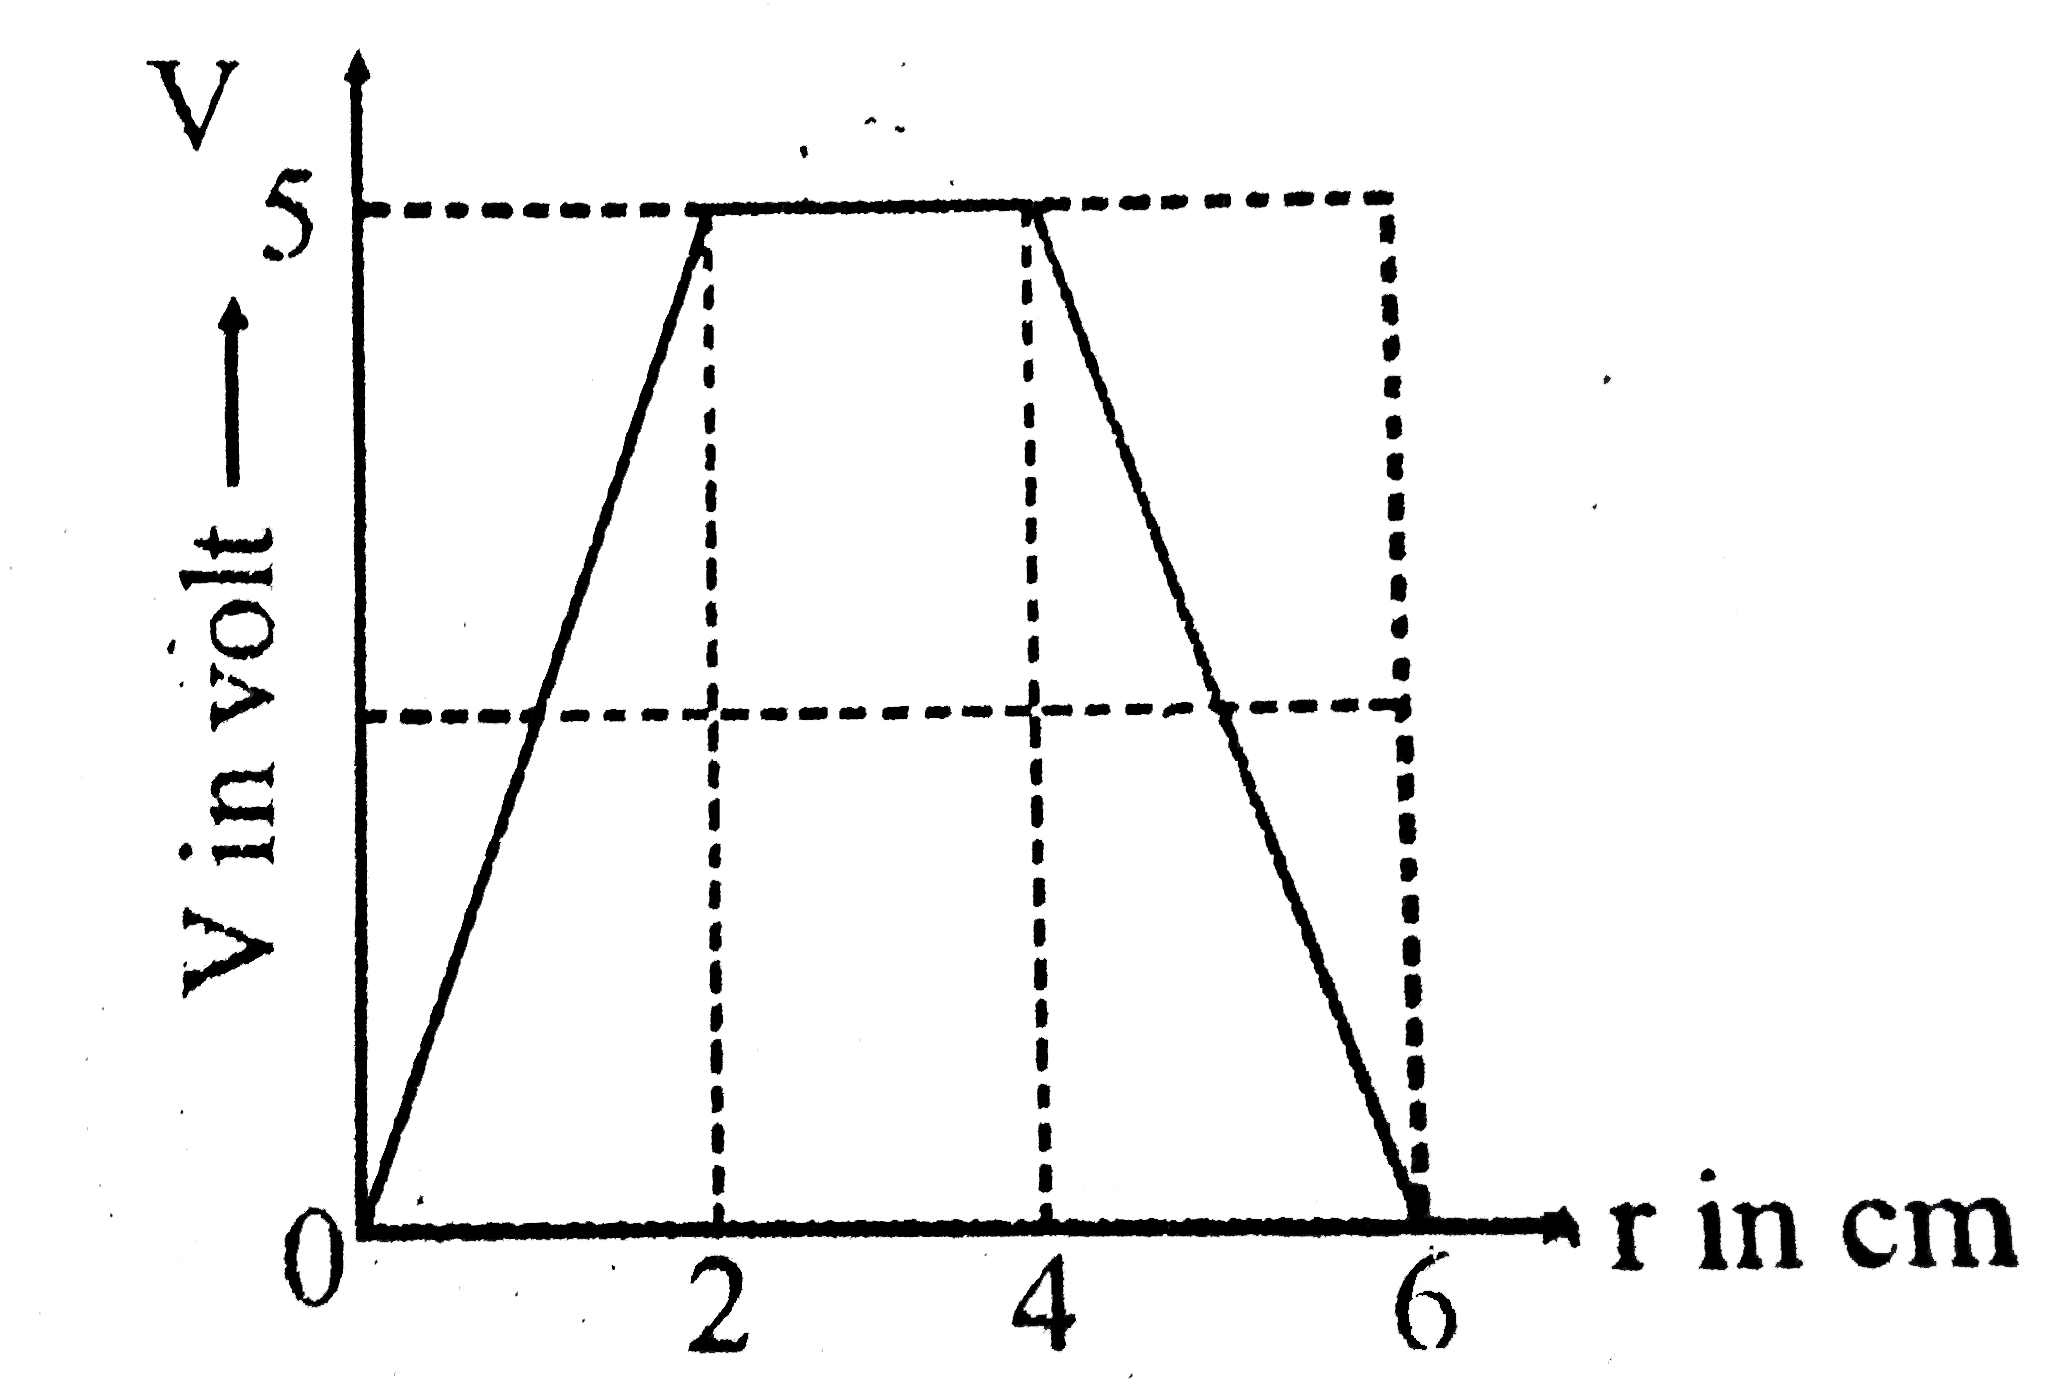
View SolutionThe variation of potential with distance r from a fixed point is shown in fig. The electric field at r = 5cm, is :
View SolutionThe variation of potential with distance R from the fixed point is shown in (Fig. 3.125).
 .
.
The electric field at R=5m is.
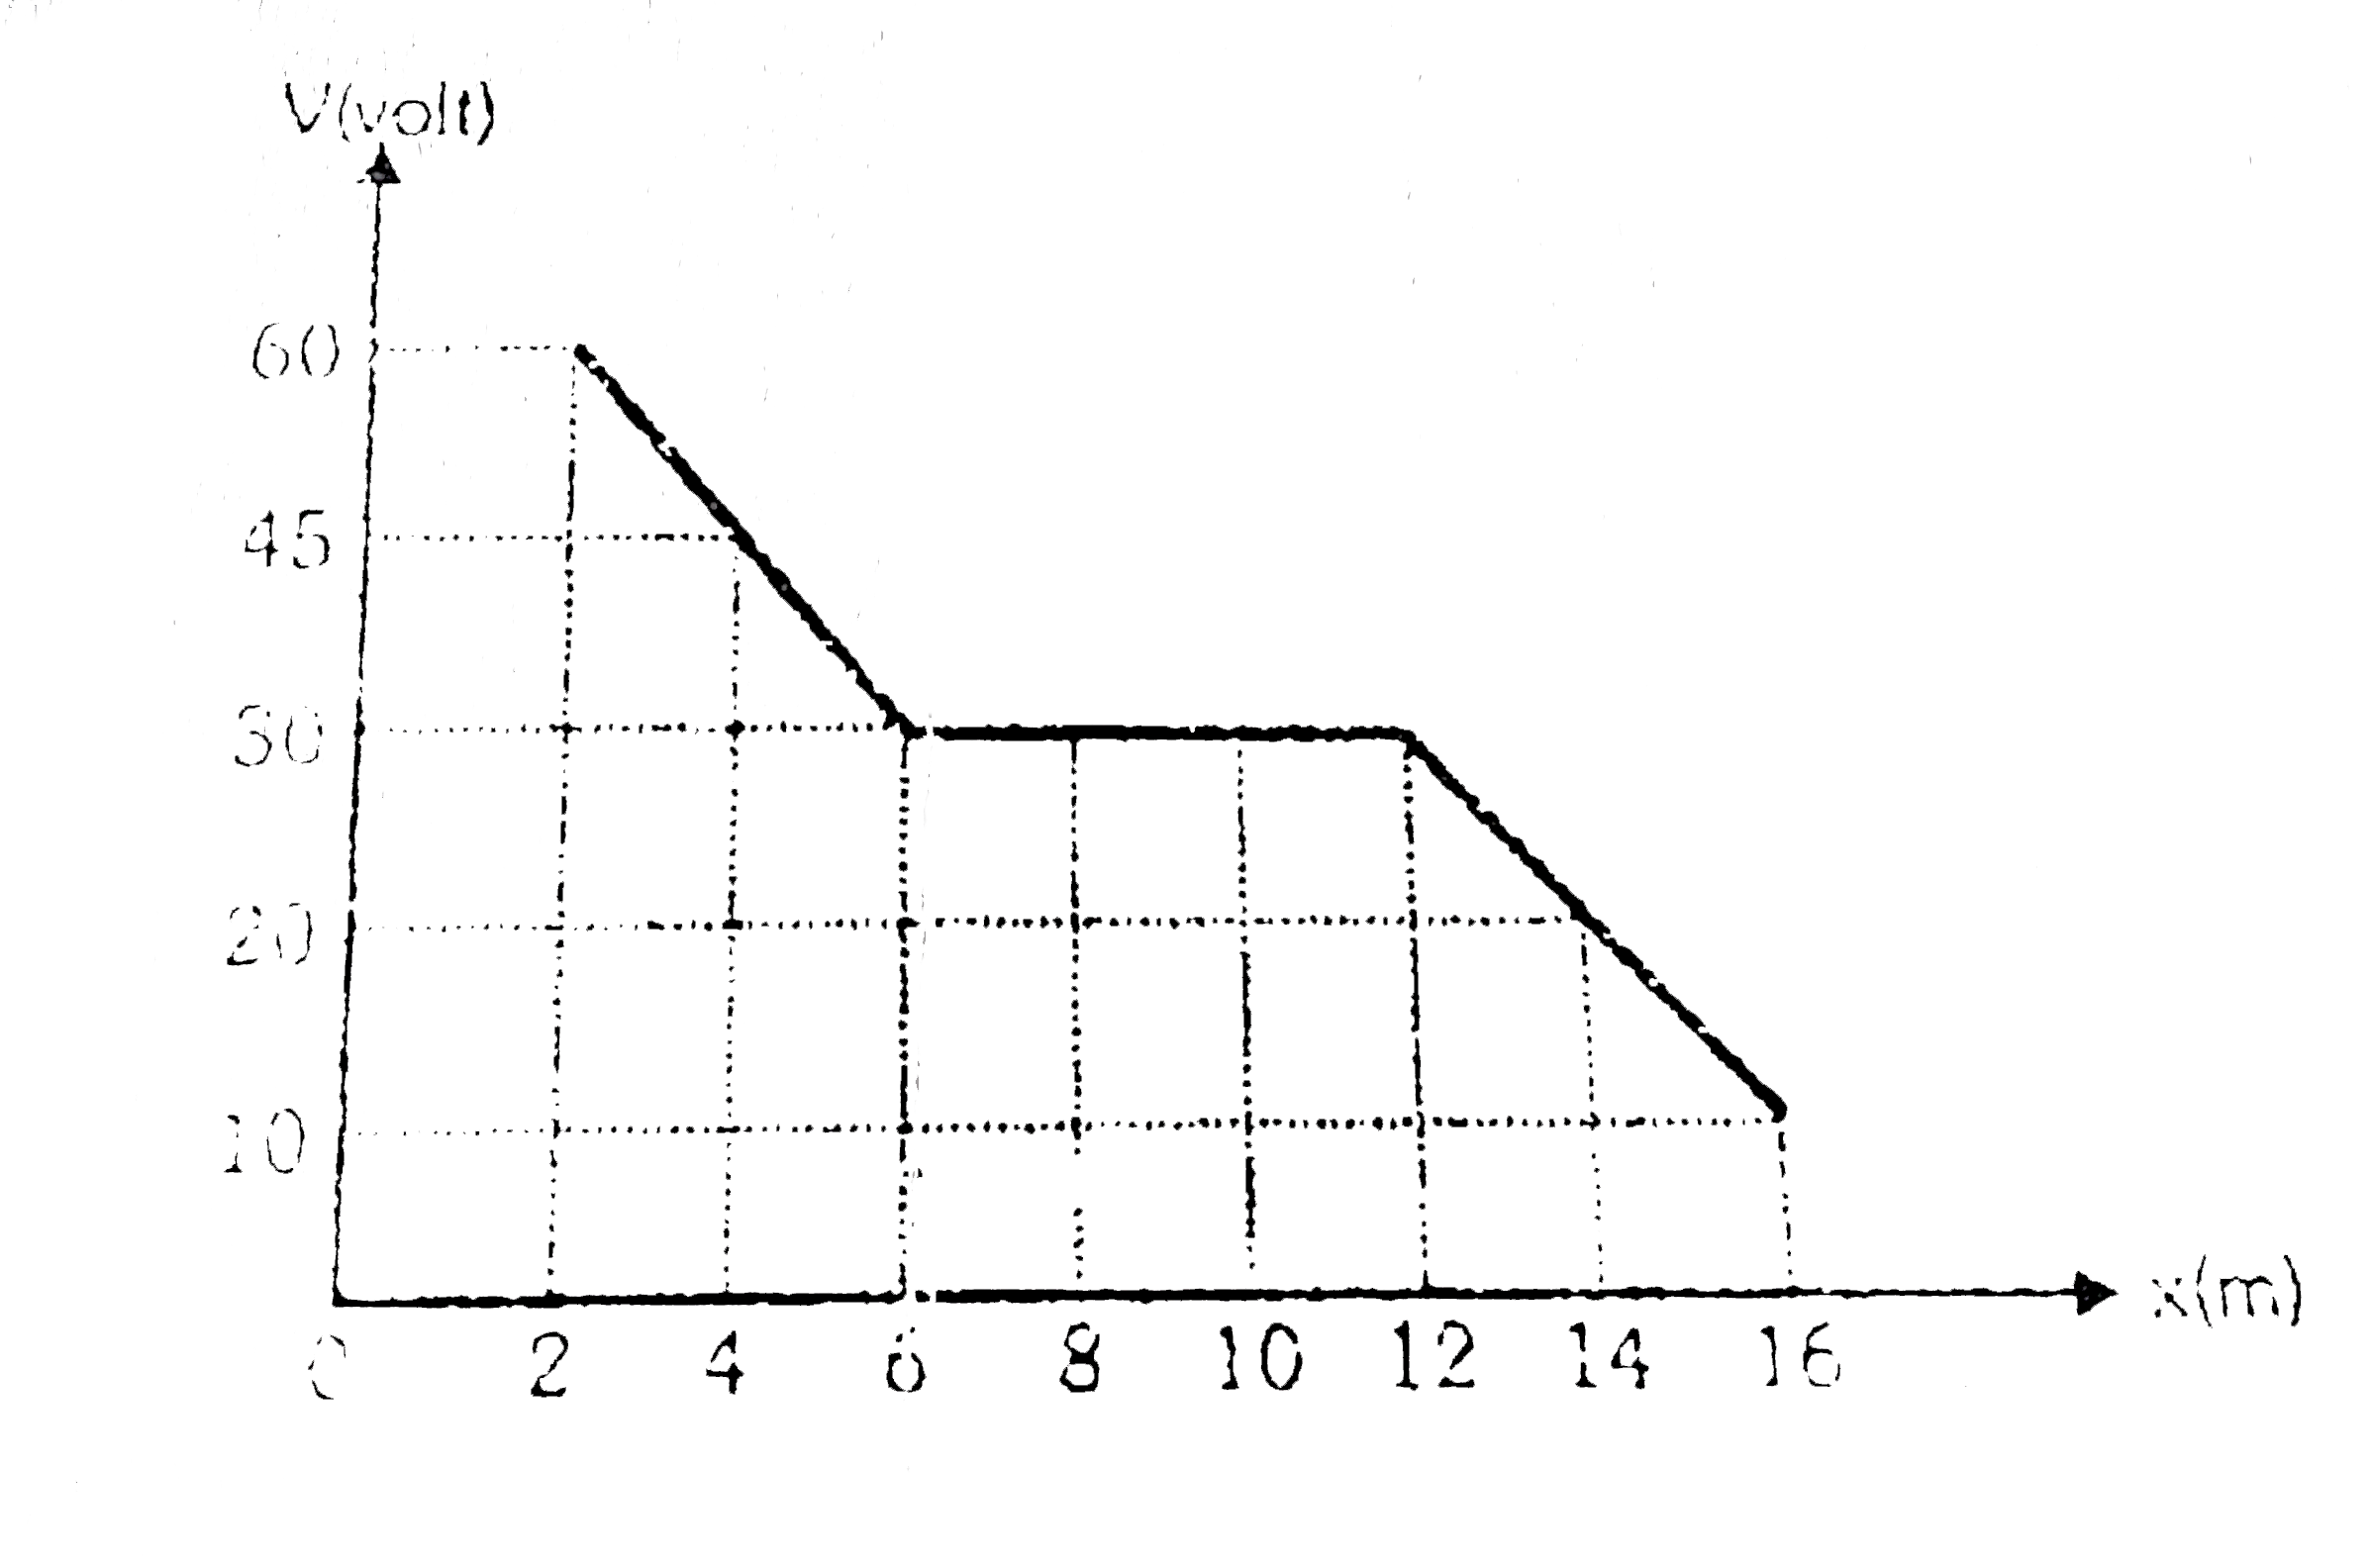
View SolutionThe variation of potential with distance x from a fixed point is shown in figure. Find the magnitude of the electric field (in V/m) at x=13m.
View SolutionThe variation of potential with distance R from a fixed point is as shown below. A charge - q is put at R = 3 m and released. The charge will
View SolutionAn uncharged metallic solid sphere of radius R is placed at a distance 2R from point charge Q as shown in figure. The electric field intensity due to induced charge at centre of sphere is
View SolutionThe nuclear charge (Ze) is non uniformlly distribute with in a nucleus of radius r. The charge densilty ρ(r) (charge per unit volume) is dependent only on the radial distance r form the centre of the nucleus s shown in figure. The electric field is only along the radial direction.
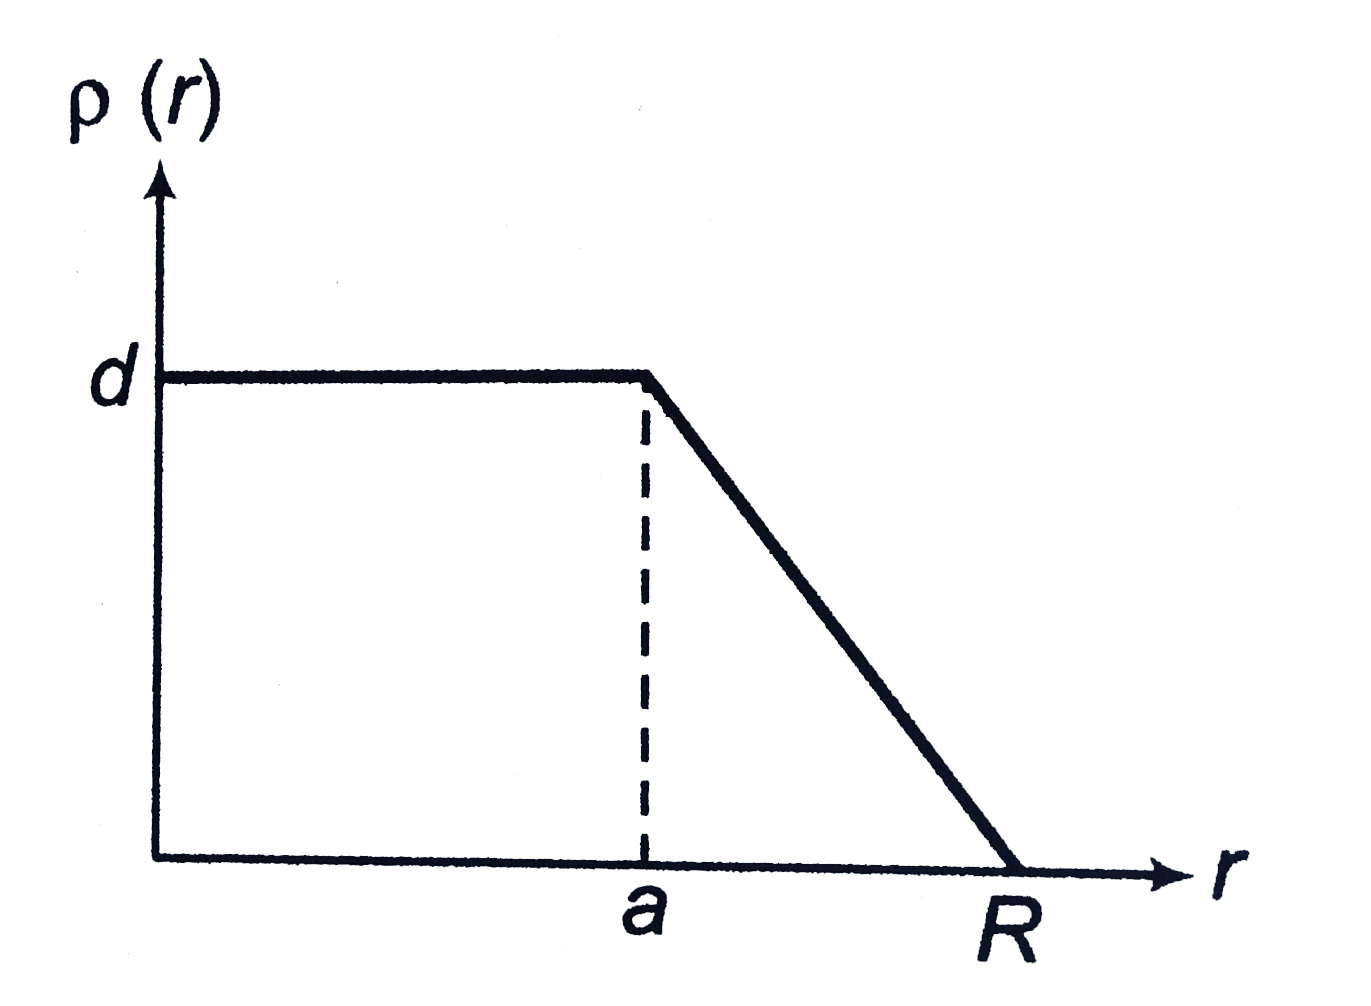
The electric field within the nucleus is generaly observed to be linearly dependent on r. This implies
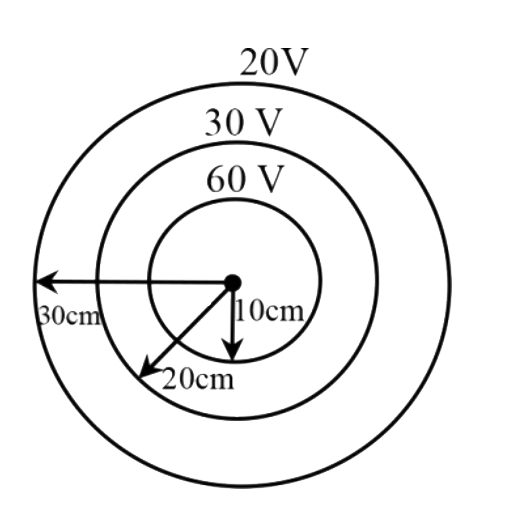
View SolutionA few spherical equipotential surfaces are shown in the figure. The electric field at any point, at a distance x from the centre, is
View SolutionA cell of e.m.f E and internal resitance r ,is connected to an external resistance R. the variation of potential difference V across the resistance R as function of R as shown in the figure, is the best represented by curve
_PHY_E01_011_Q01.png)
View SolutionWhich one of the following graphs represents the variation of electric field with distance r from the centre of a charged spherical conductor of radius R?
View Solution
