Age structure diagrams (A, B and C) for the populations are shown below. They represent:-
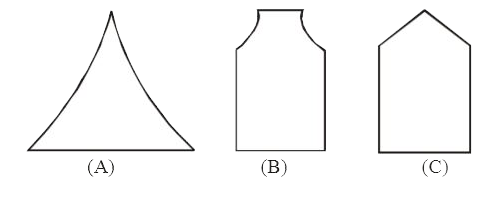
A-Declining populations
B- Stable population
C- Growing population
A-Growing population
B- Stationary population
C- Declining populations
A-Exponential growth
B- Indeterminate growth
C- Stationary population
A-Growing population
B- and C- Stable population
The correct Answer is:D
Step by step video & image solution for Age structure diagrams (A, B and C) for the populations are shown below. They represent:- by Biology experts to help you in doubts & scoring excellent marks in Class 12 exams.
Updated on:21/07/2023Topper's Solved these Questions
Similar Questions
Knowledge Check
An urn shaped population age pyramid represents
Agrowing populationBstatic populationCdeclining populationDextinct populationIn the diagram shown below:
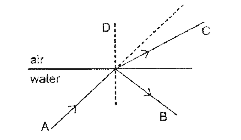 AB is incident ray and C is refracted ray.BA is incident ray and B is refracted ray.CC is incident ray and Bis refracted ray.DA is incident ray and C is refracted ray.
An urn shaped population age pyramid represents
View SolutionIn the diagram give n below shaded part represents :-

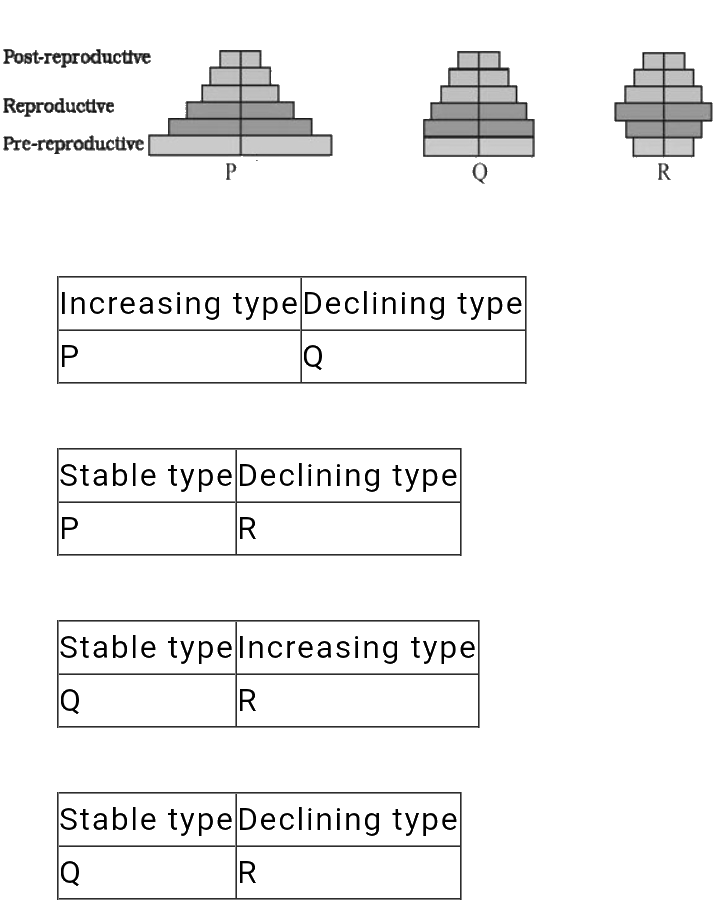
View SolutionVarious age pyramids (P-R) for human population are shown below. Select the option with correct identification.
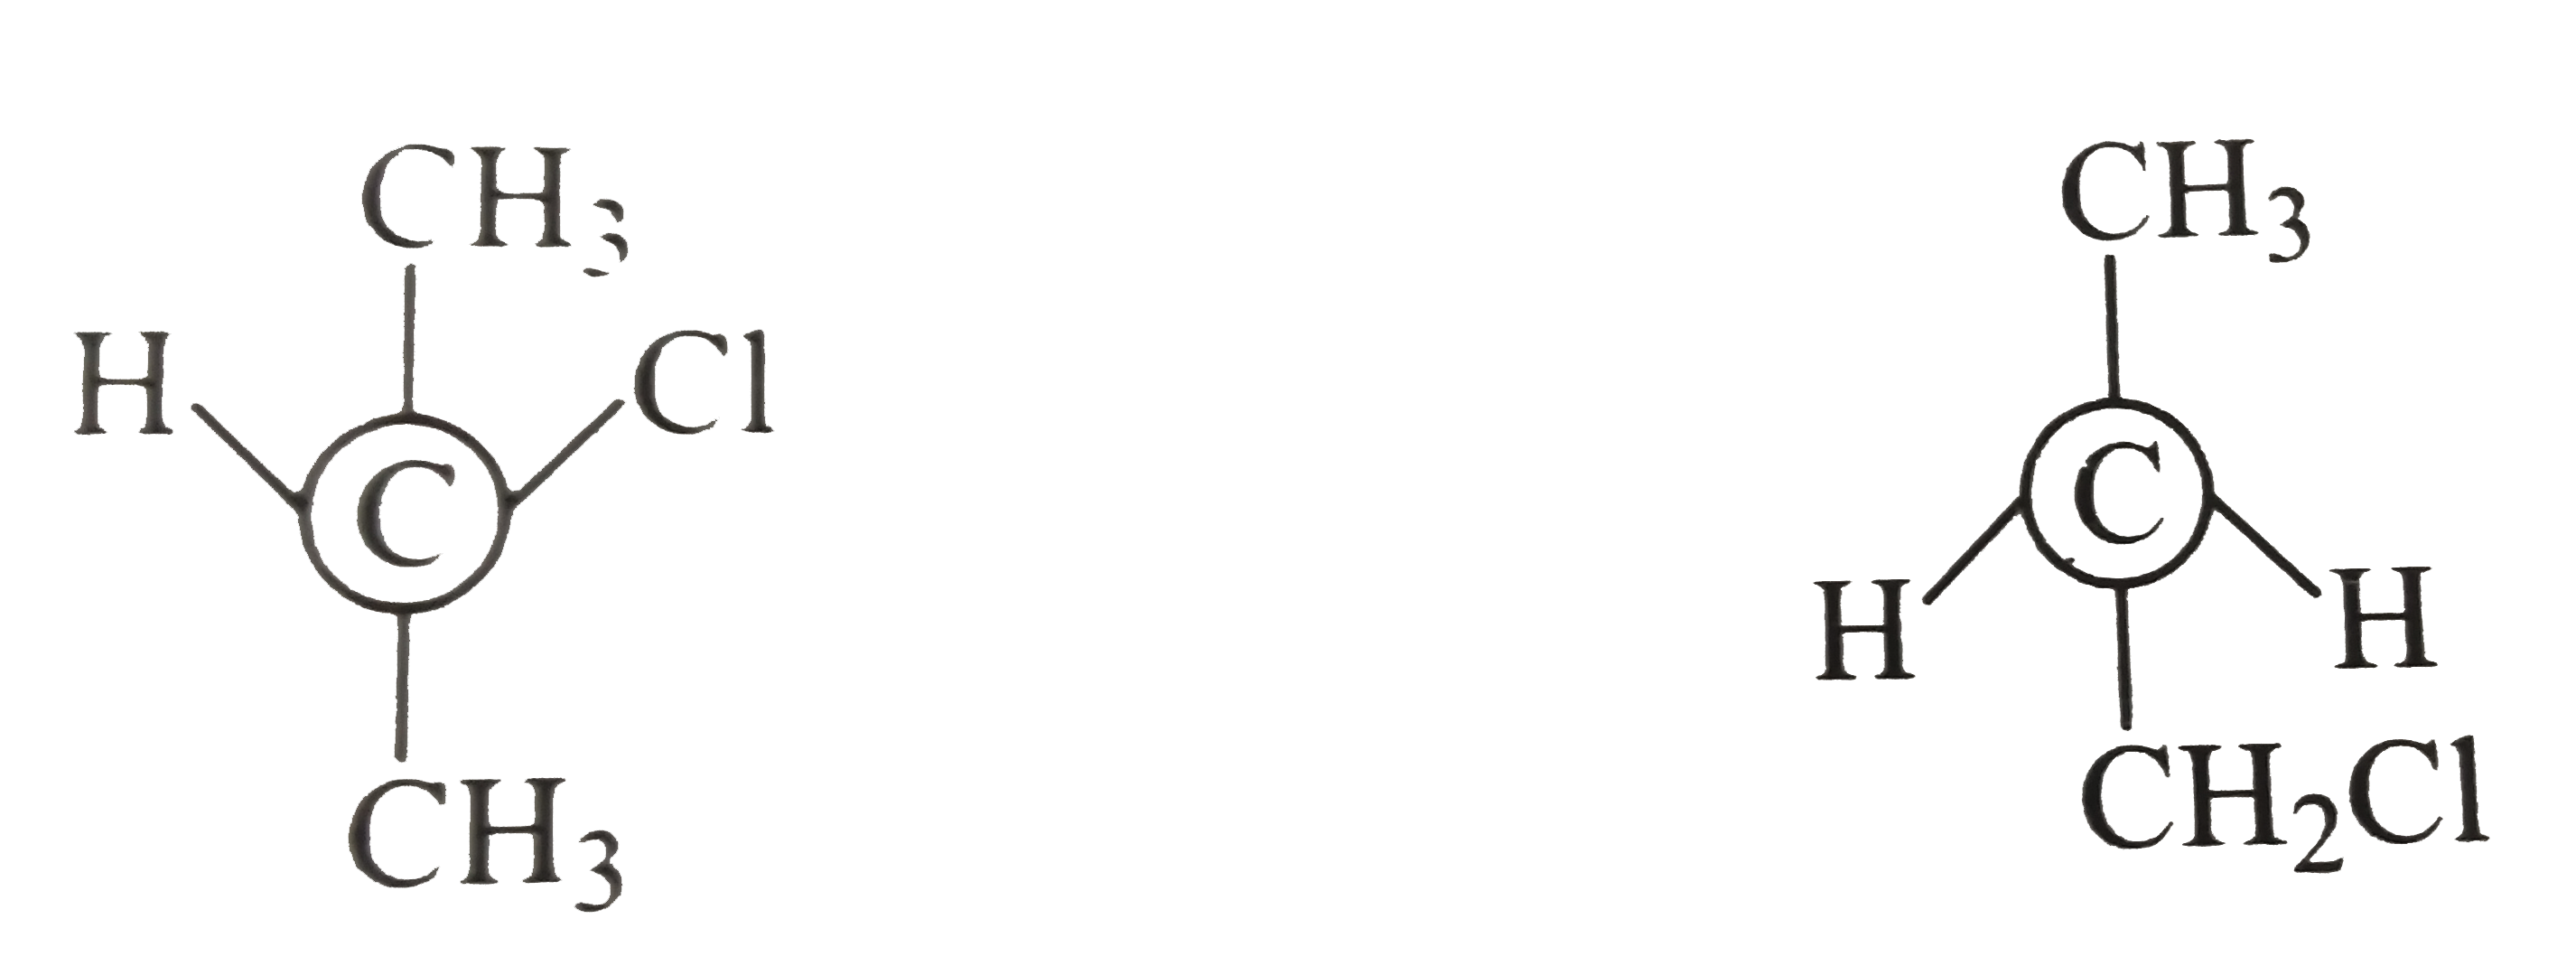
View SolutionThe pair of structures given below represents:
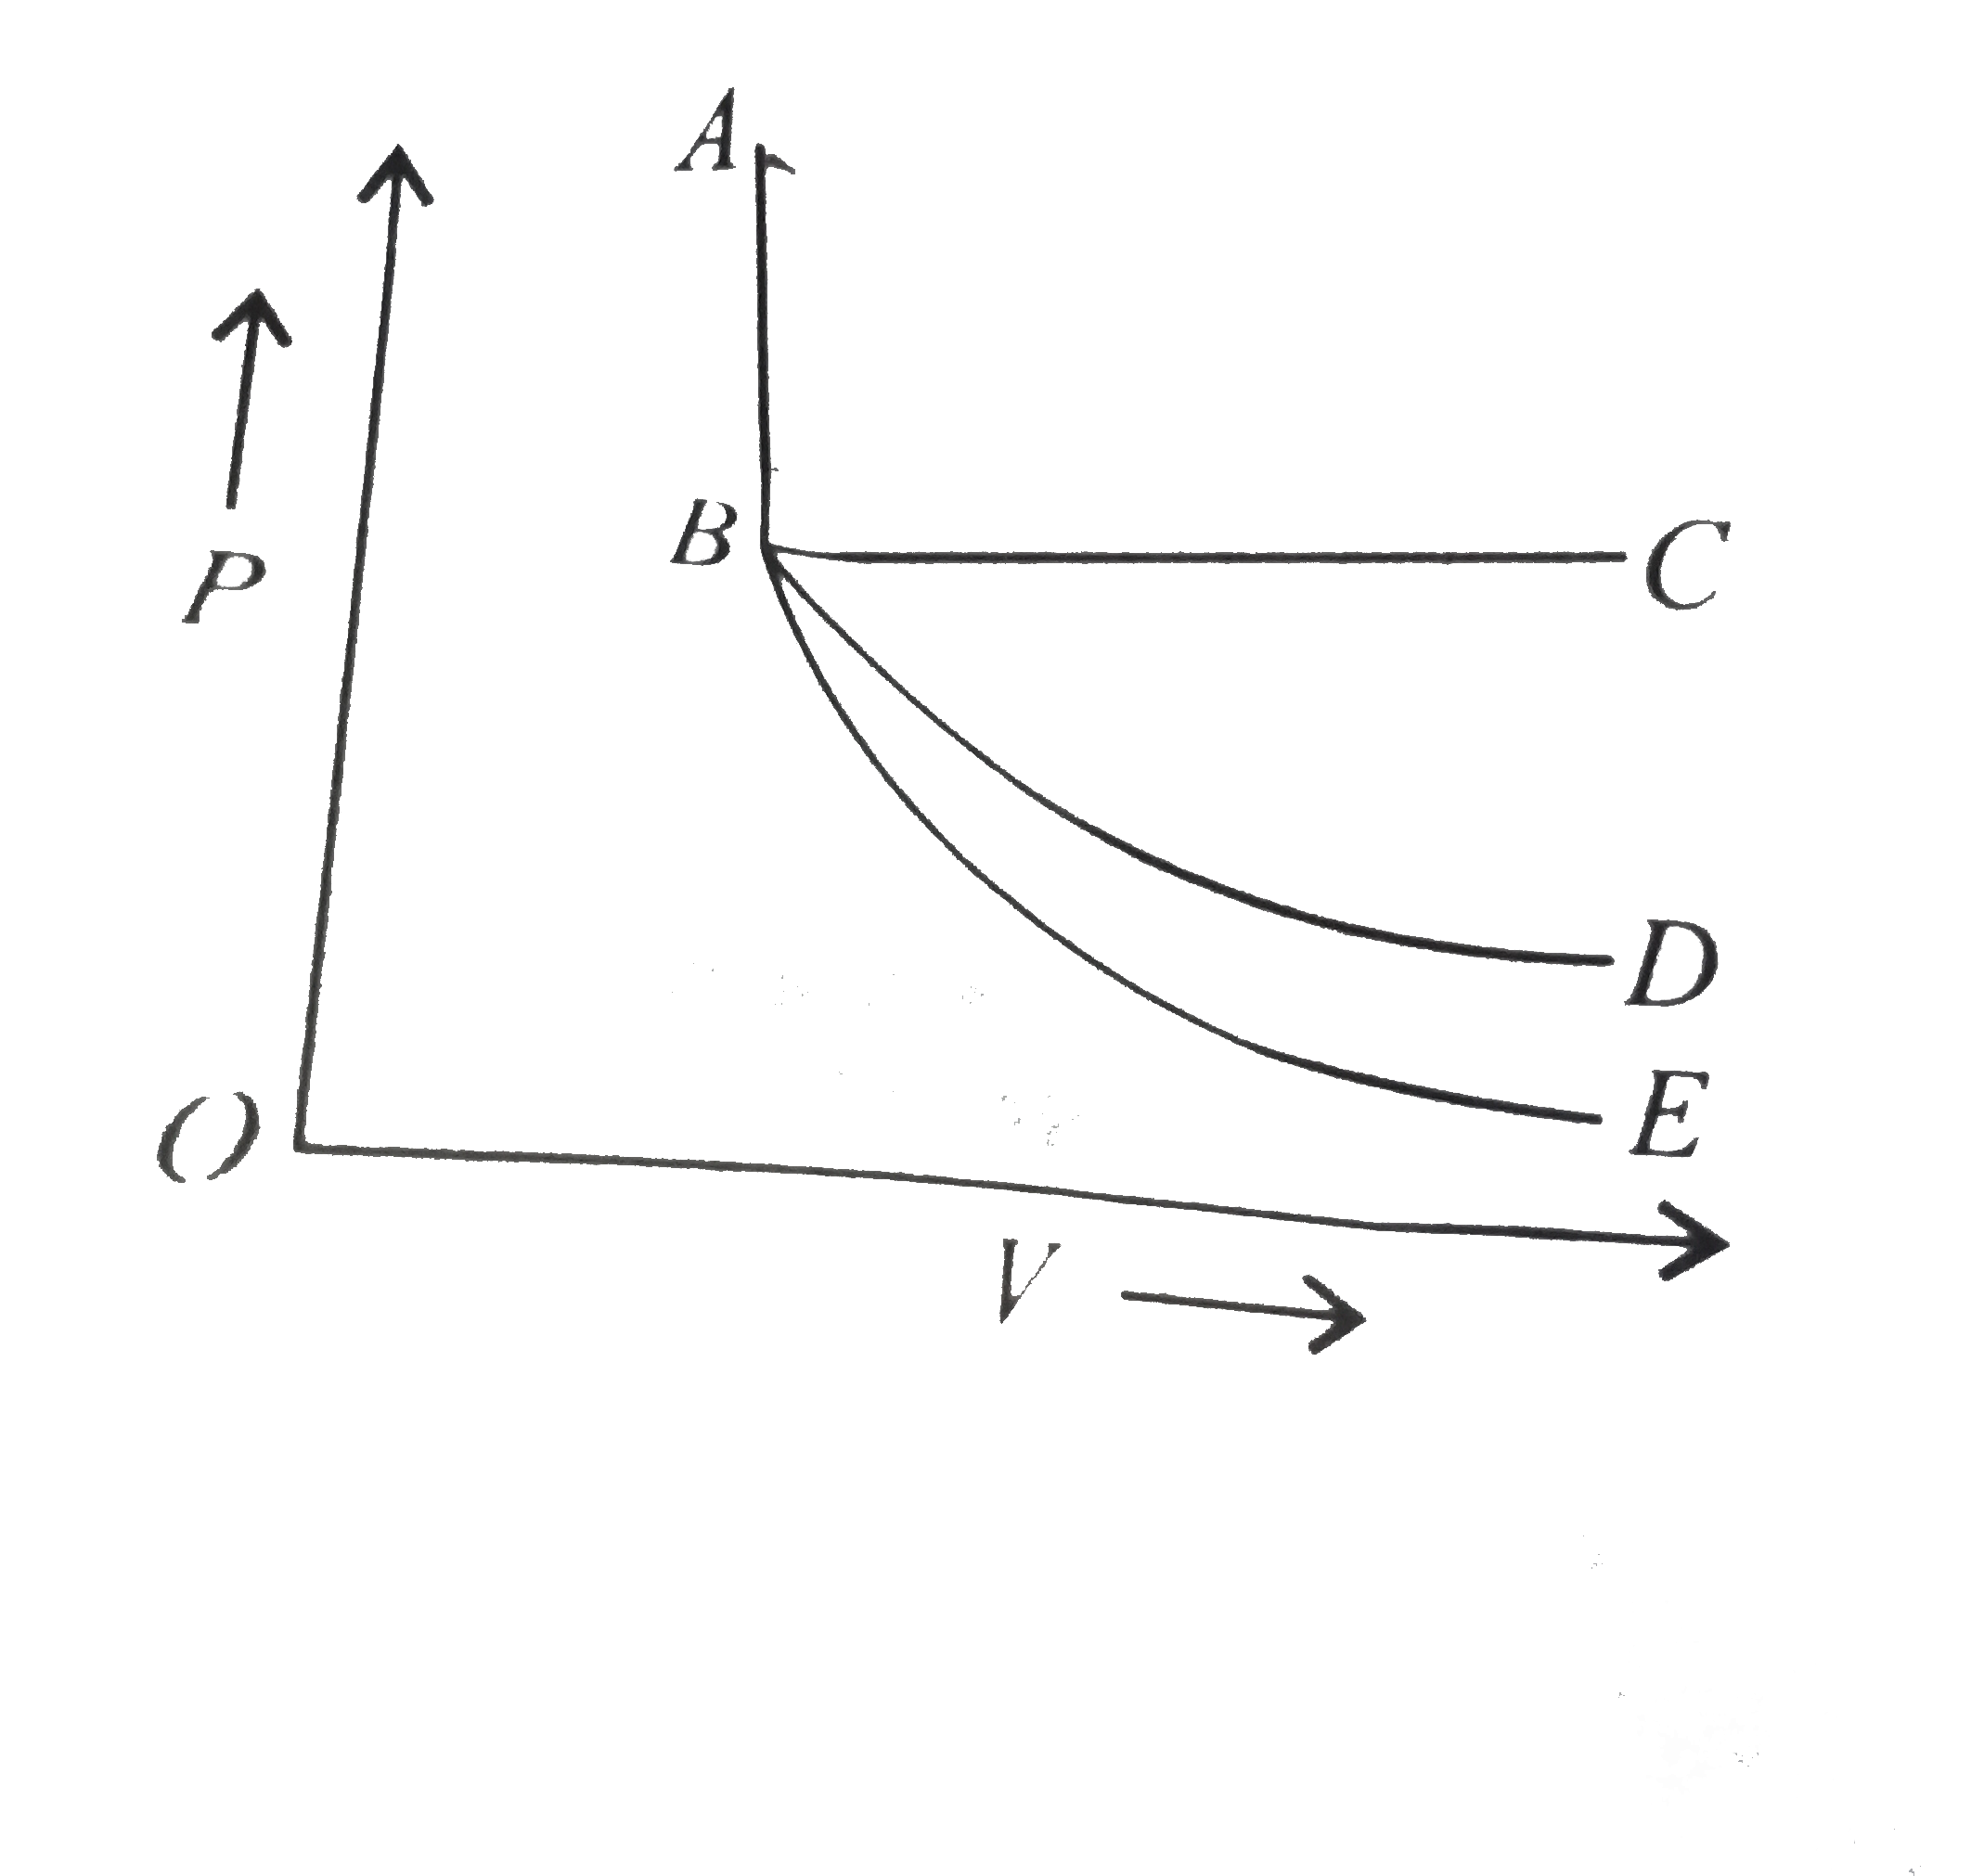
View SolutionIn P−V diagram shown below,
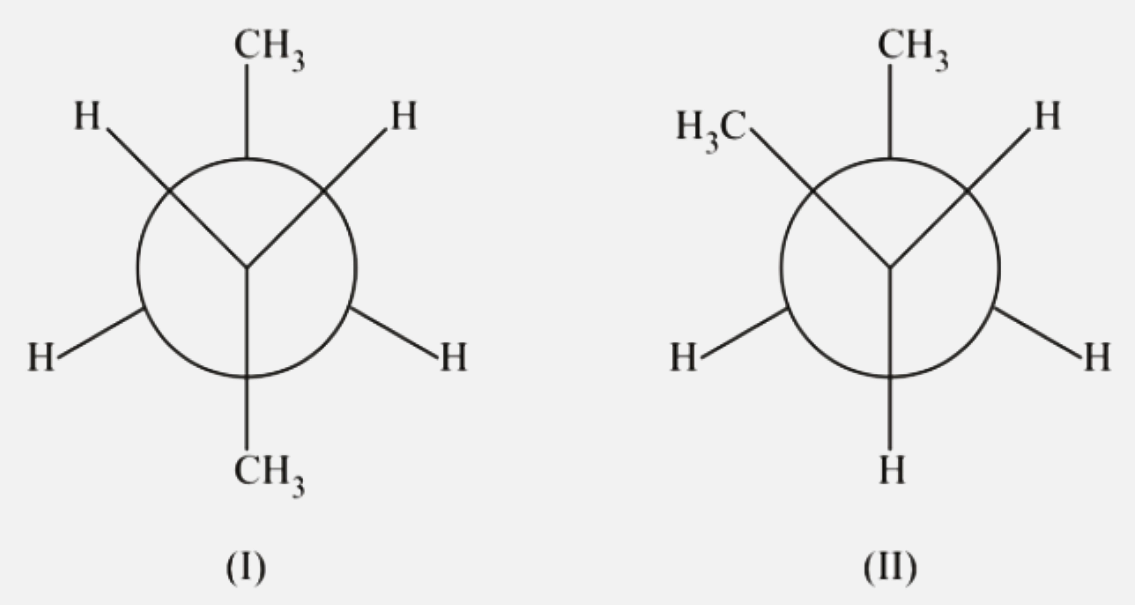
View SolutionThe pair of structure given below represents
View Solution

