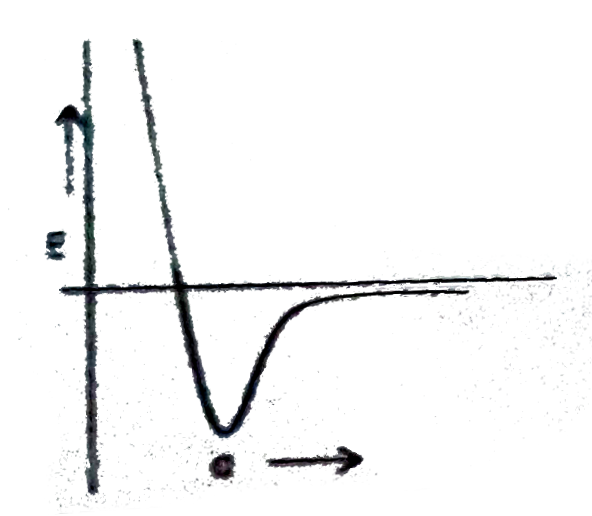
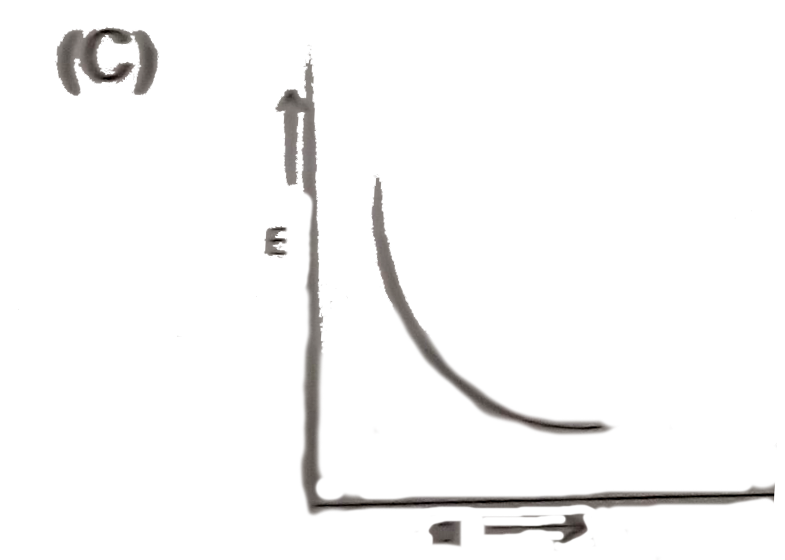
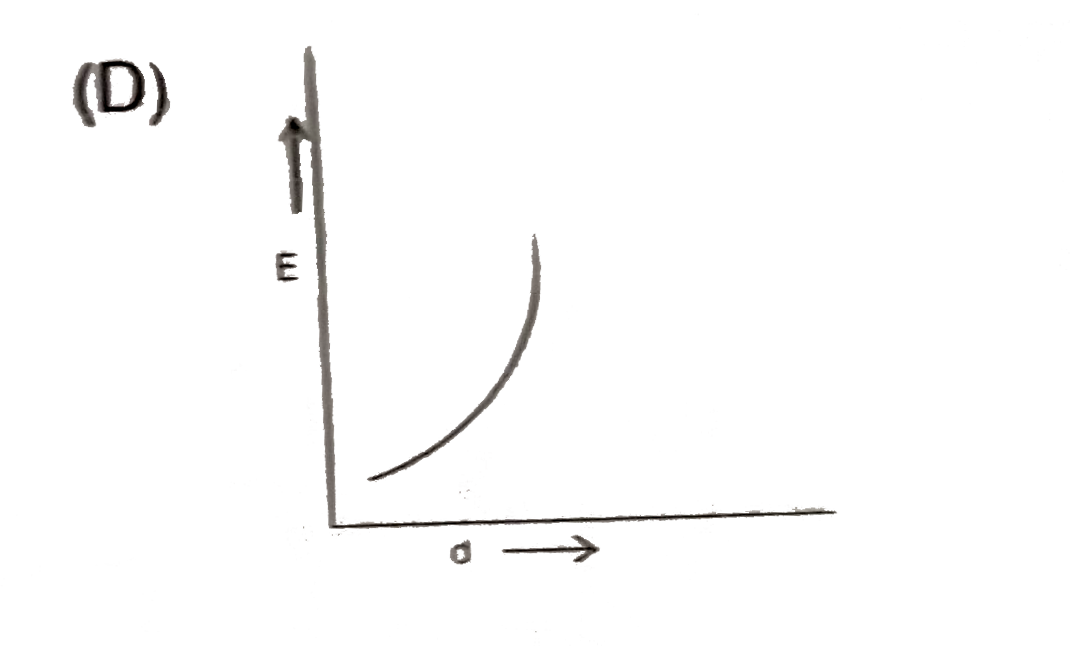
Which plot best repersent the potential energy (E) of two hydrogen atoms as they approach one another to form a hydrogen molecule ?


The correct Answer is:A
To determine which plot best represents the potential energy (E) of two hydrogen atoms as they approach one another to form a hydrogen molecule, we need to analyze the behavior of potential energy as the distance between the two atoms changes.
1. Understanding the Initial State:
- When two hydrogen atoms are far apart, there is no interaction between them. This means that the potential energy is at a relatively high level because the atoms are not influenced by each other.
Hint: Think about how energy levels change with distance; far apart means no interaction.
2. Approaching Each Other:
- As the hydrogen atoms begin to approach each other, they start to experience attractive forces. This attraction causes the potential energy to decrease. The potential energy decreases as the atoms come closer together until they reach a point of optimal interaction.
Hint: Remember that attraction lowers potential energy; visualize the atoms moving closer together.
3. Optimal Distance:
- At a certain distance, known as the bond length, the potential energy reaches a minimum. This is the most stable configuration for the hydrogen molecule.
Hint: Identify the point where energy is lowest; this is where the atoms are most stable.
4. Repulsive Forces:
- If the atoms get too close (beyond the optimal distance), repulsive forces come into play due to the overlap of electron clouds. This causes the potential energy to increase sharply as the distance decreases further.
Hint: Consider what happens when atoms are too close; they push away from each other.
5. Graph Interpretation:
- The correct plot will show a curve that initially decreases as the distance decreases (indicating attraction), reaches a minimum at the bond length, and then increases sharply as the distance decreases further (indicating repulsion).
Hint: Look for a graph that has a U-shape, with a minimum point representing the bond length.
Conclusion:
Based on the analysis, the plot that best represents the potential energy of two hydrogen atoms as they approach one another to form a hydrogen molecule is option A. This plot correctly illustrates the decrease in potential energy due to attraction, the minimum energy at bond length, and the increase in energy due to repulsion when the atoms are too close.
- When two hydrogen atoms are far apart, there is no interaction between them. This means that the potential energy is at a relatively high level because the atoms are not influenced by each other.
- As the hydrogen atoms begin to approach each other, they start to experience attractive forces. This attraction causes the potential energy to decrease. The potential energy decreases as the atoms come closer together until they reach a point of optimal interaction.
- At a certain distance, known as the bond length, the potential energy reaches a minimum. This is the most stable configuration for the hydrogen molecule.
- If the atoms get too close (beyond the optimal distance), repulsive forces come into play due to the overlap of electron clouds. This causes the potential energy to increase sharply as the distance decreases further.
- The correct plot will show a curve that initially decreases as the distance decreases (indicating attraction), reaches a minimum at the bond length, and then increases sharply as the distance decreases further (indicating repulsion).
Based on the analysis, the plot that best represents the potential energy of two hydrogen atoms as they approach one another to form a hydrogen molecule is option A. This plot correctly illustrates the decrease in potential energy due to attraction, the minimum energy at bond length, and the increase in energy due to repulsion when the atoms are too close.
Similar Questions
The energies of orbitals of hydrogen atom are in the order
View SolutionLet the potential energy of the hydrogen atom in the ground state be zero . Then its energy in the excited state will be
View Solutionif the potential energy of a hydrogen atom in the ground state is assumed to be zero, then total energy of n=∞ is equal to
View SolutionThe potential energy of an electron in the fifth orbit of hydrogen atom is
View SolutionA hydrogen atom is a paramagnetic. A hydrogen molecule is –
View SolutionIn hydrogen atom, the energy of second shell eΘ
View SolutionIf the energy in the first excited state in hydrogen atom is 23.8eV then the potential energy of a hydrogen atom in the ground state can be assumed to be
View SolutionThe excited energy of a He+ ion is the same as the ground state energy of hydrogen is it always true that one of the energies of any hydrogen like ion will be the same as the ground state energy of a hydrogen atom?
View SolutionThe potential energy of an electron in hydrogen atom is −3.02eV, its kinteic energy will be
View SolutionIf the potential energy of the electron in the first allowed orbit in hydrogen atom is E: its
View Solution
