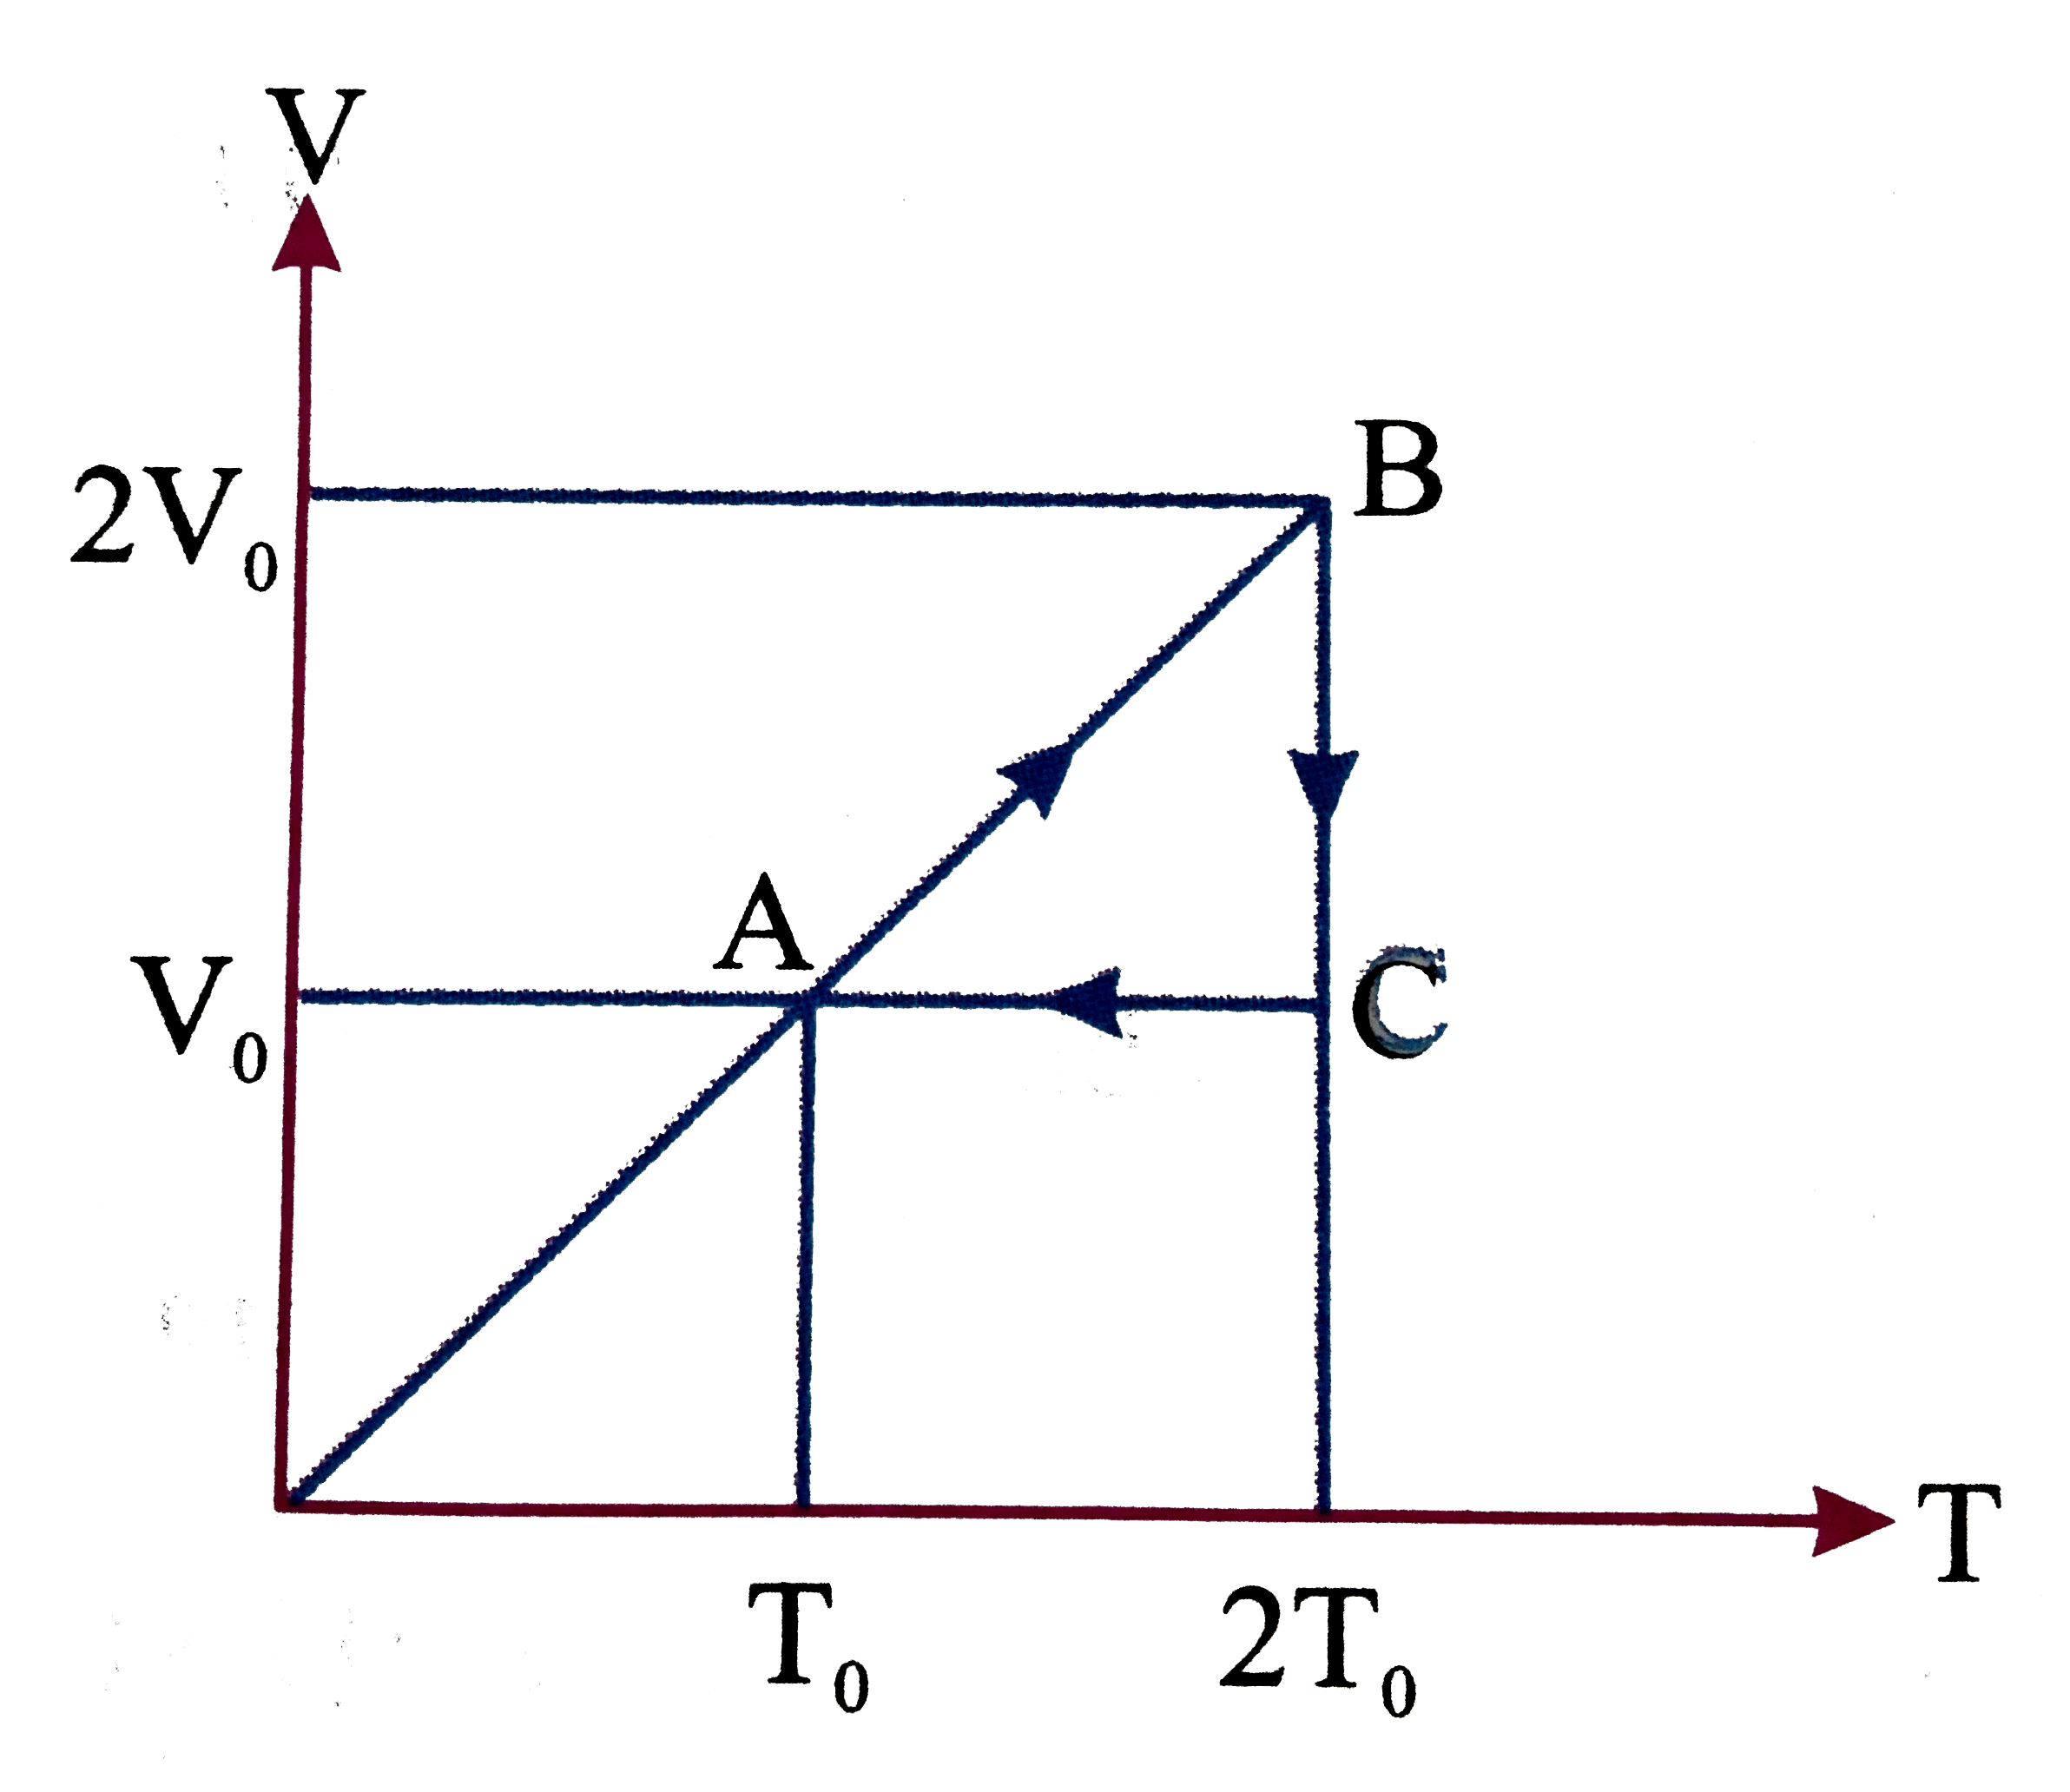
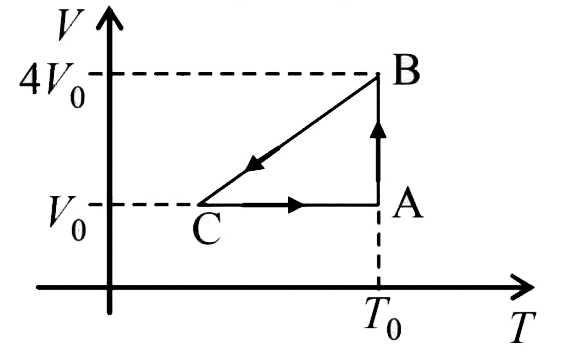
An ideal monatomic gas undergoes a cyclic process as shown in the figure. Graph of pressure versus volume of the cyclic process is
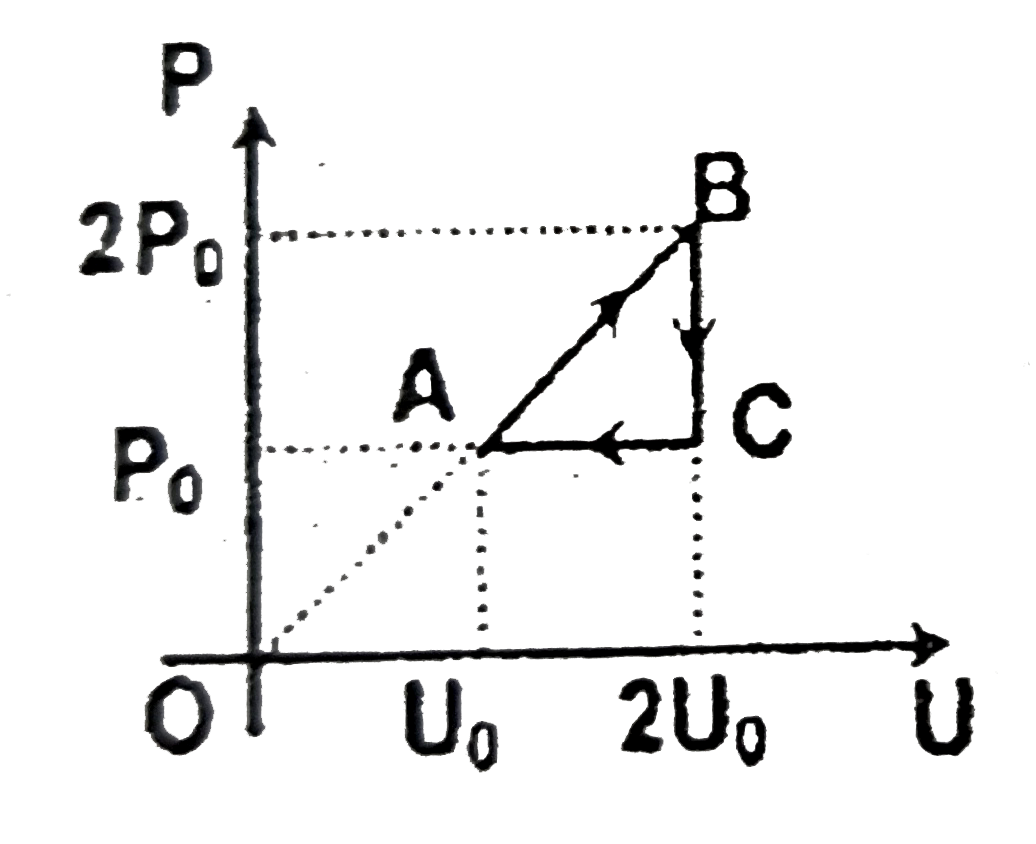
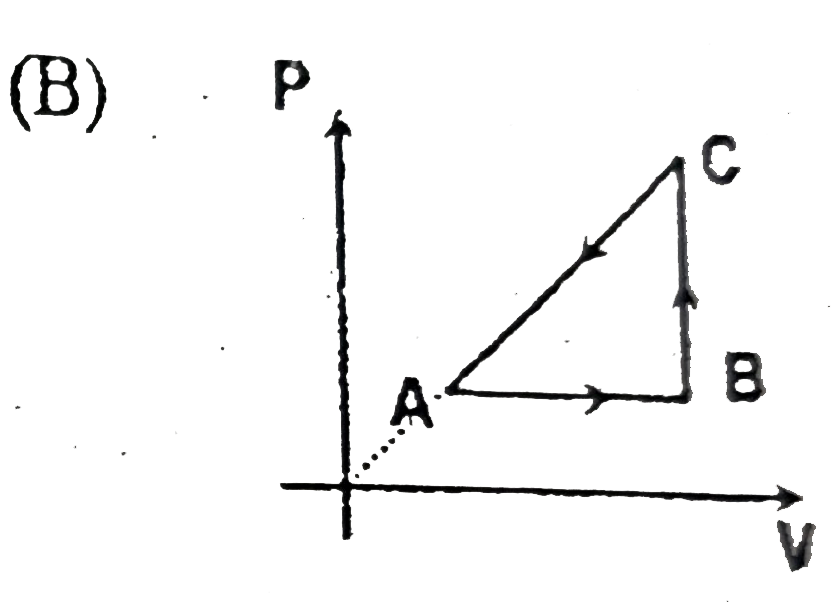
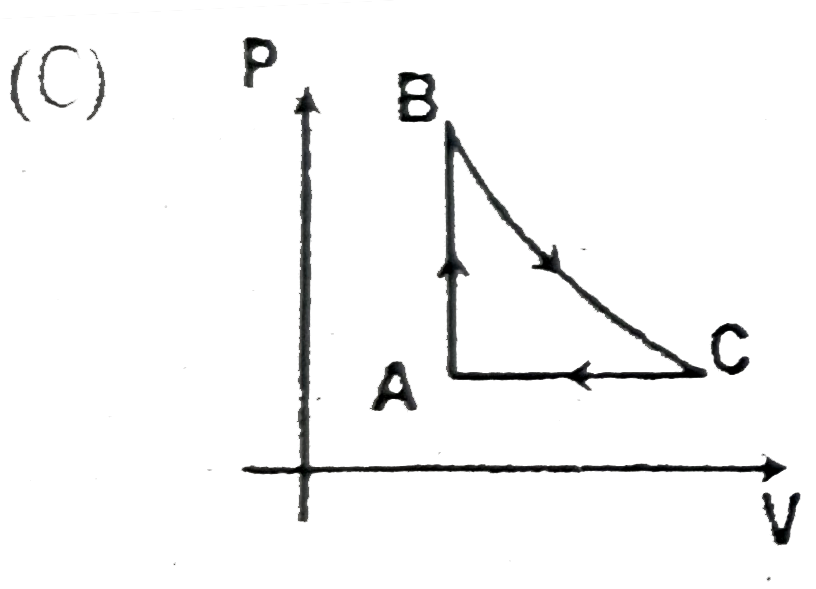
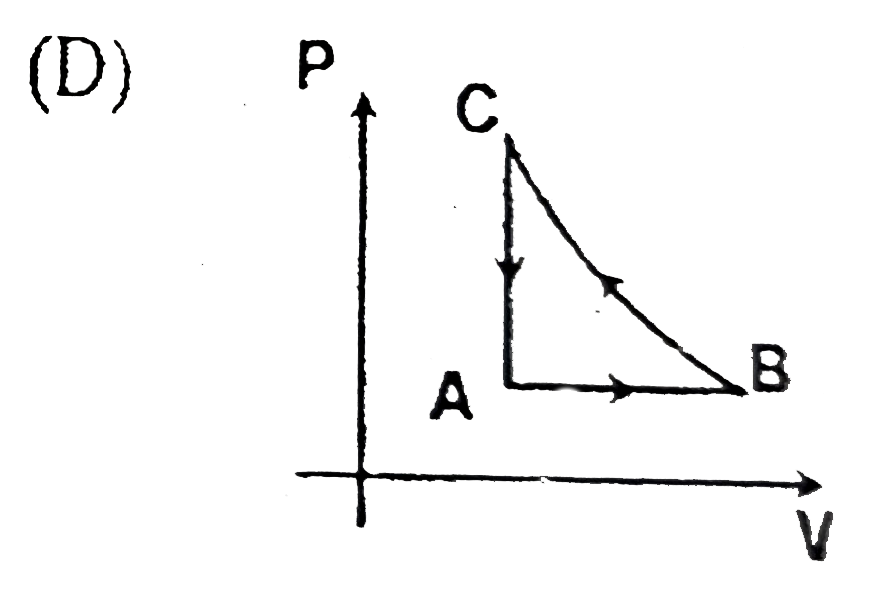
Step by step video & image solution for An ideal monatomic gas undergoes a cyclic process ABCA as shown in the figure. Graph of pressure versus volume of the cyclic process ABCA is by Physics experts to help you in doubts & scoring excellent marks in Class 12 exams.
Updated on:21/07/2023Similar Questions
Knowledge Check
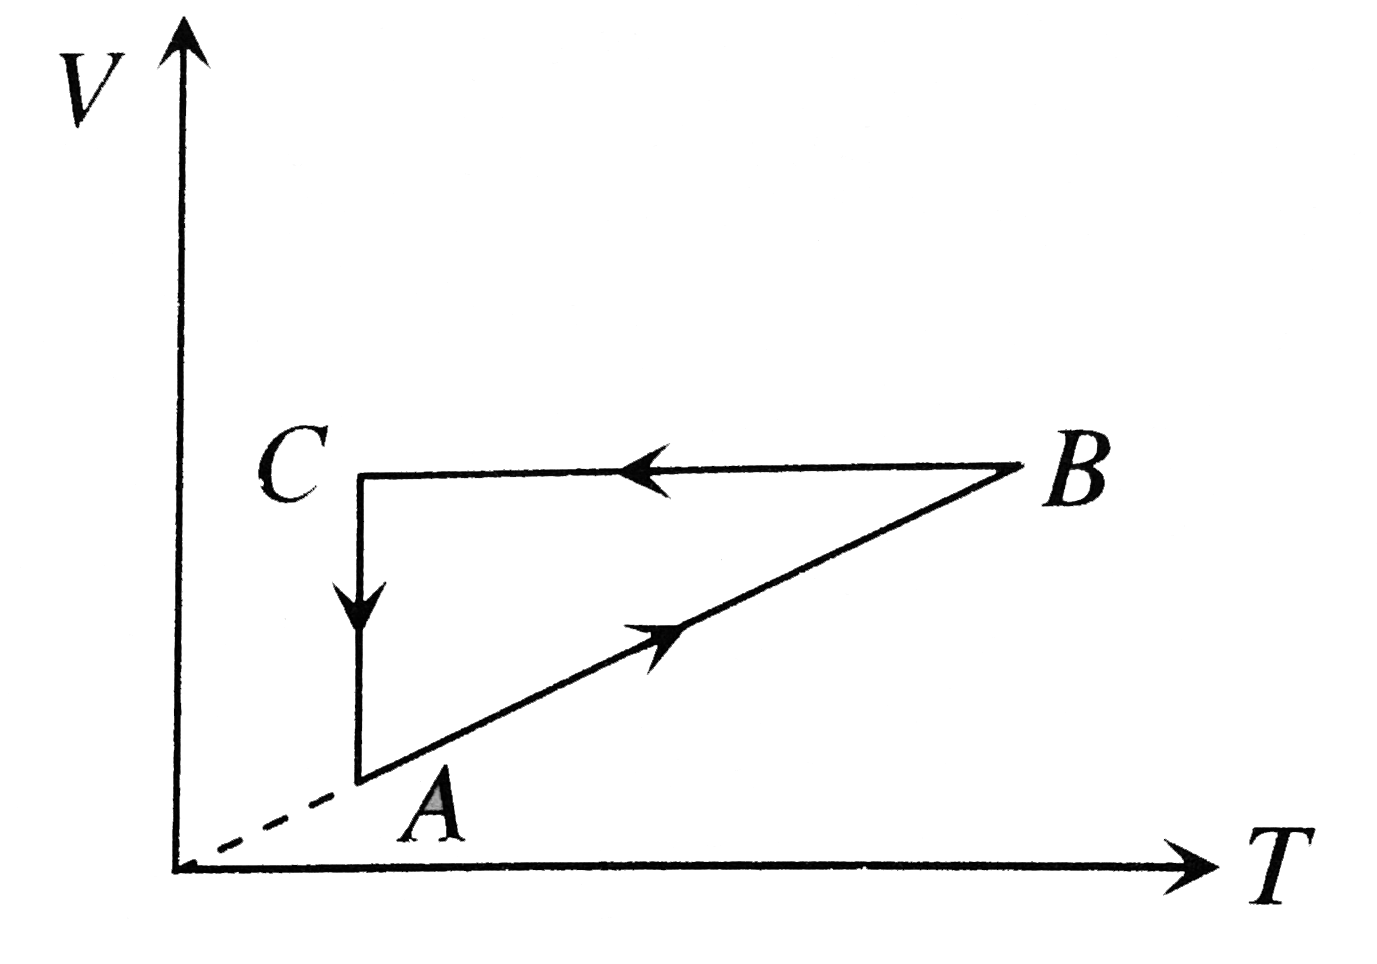
A cyclic process ABCA is shown in the V−T diagram process on the P−V
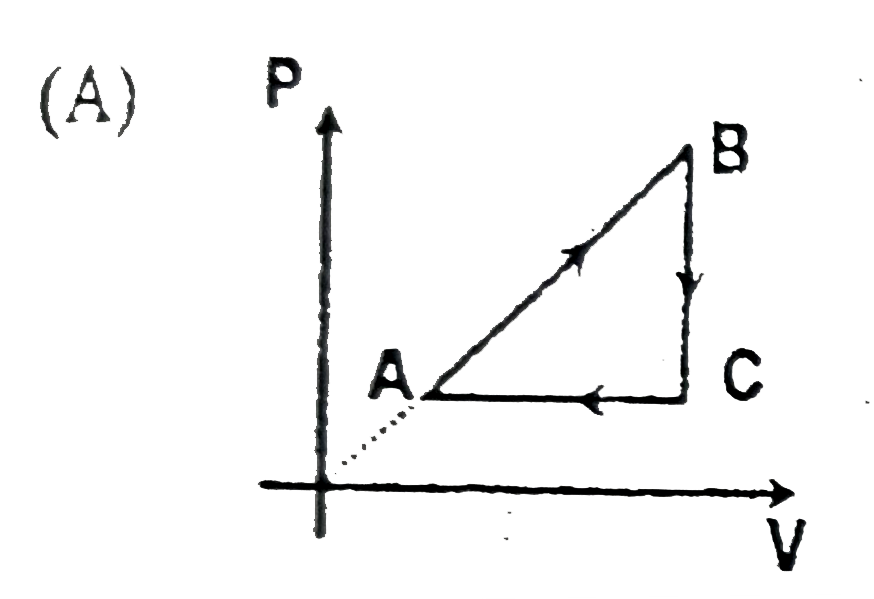
 A
A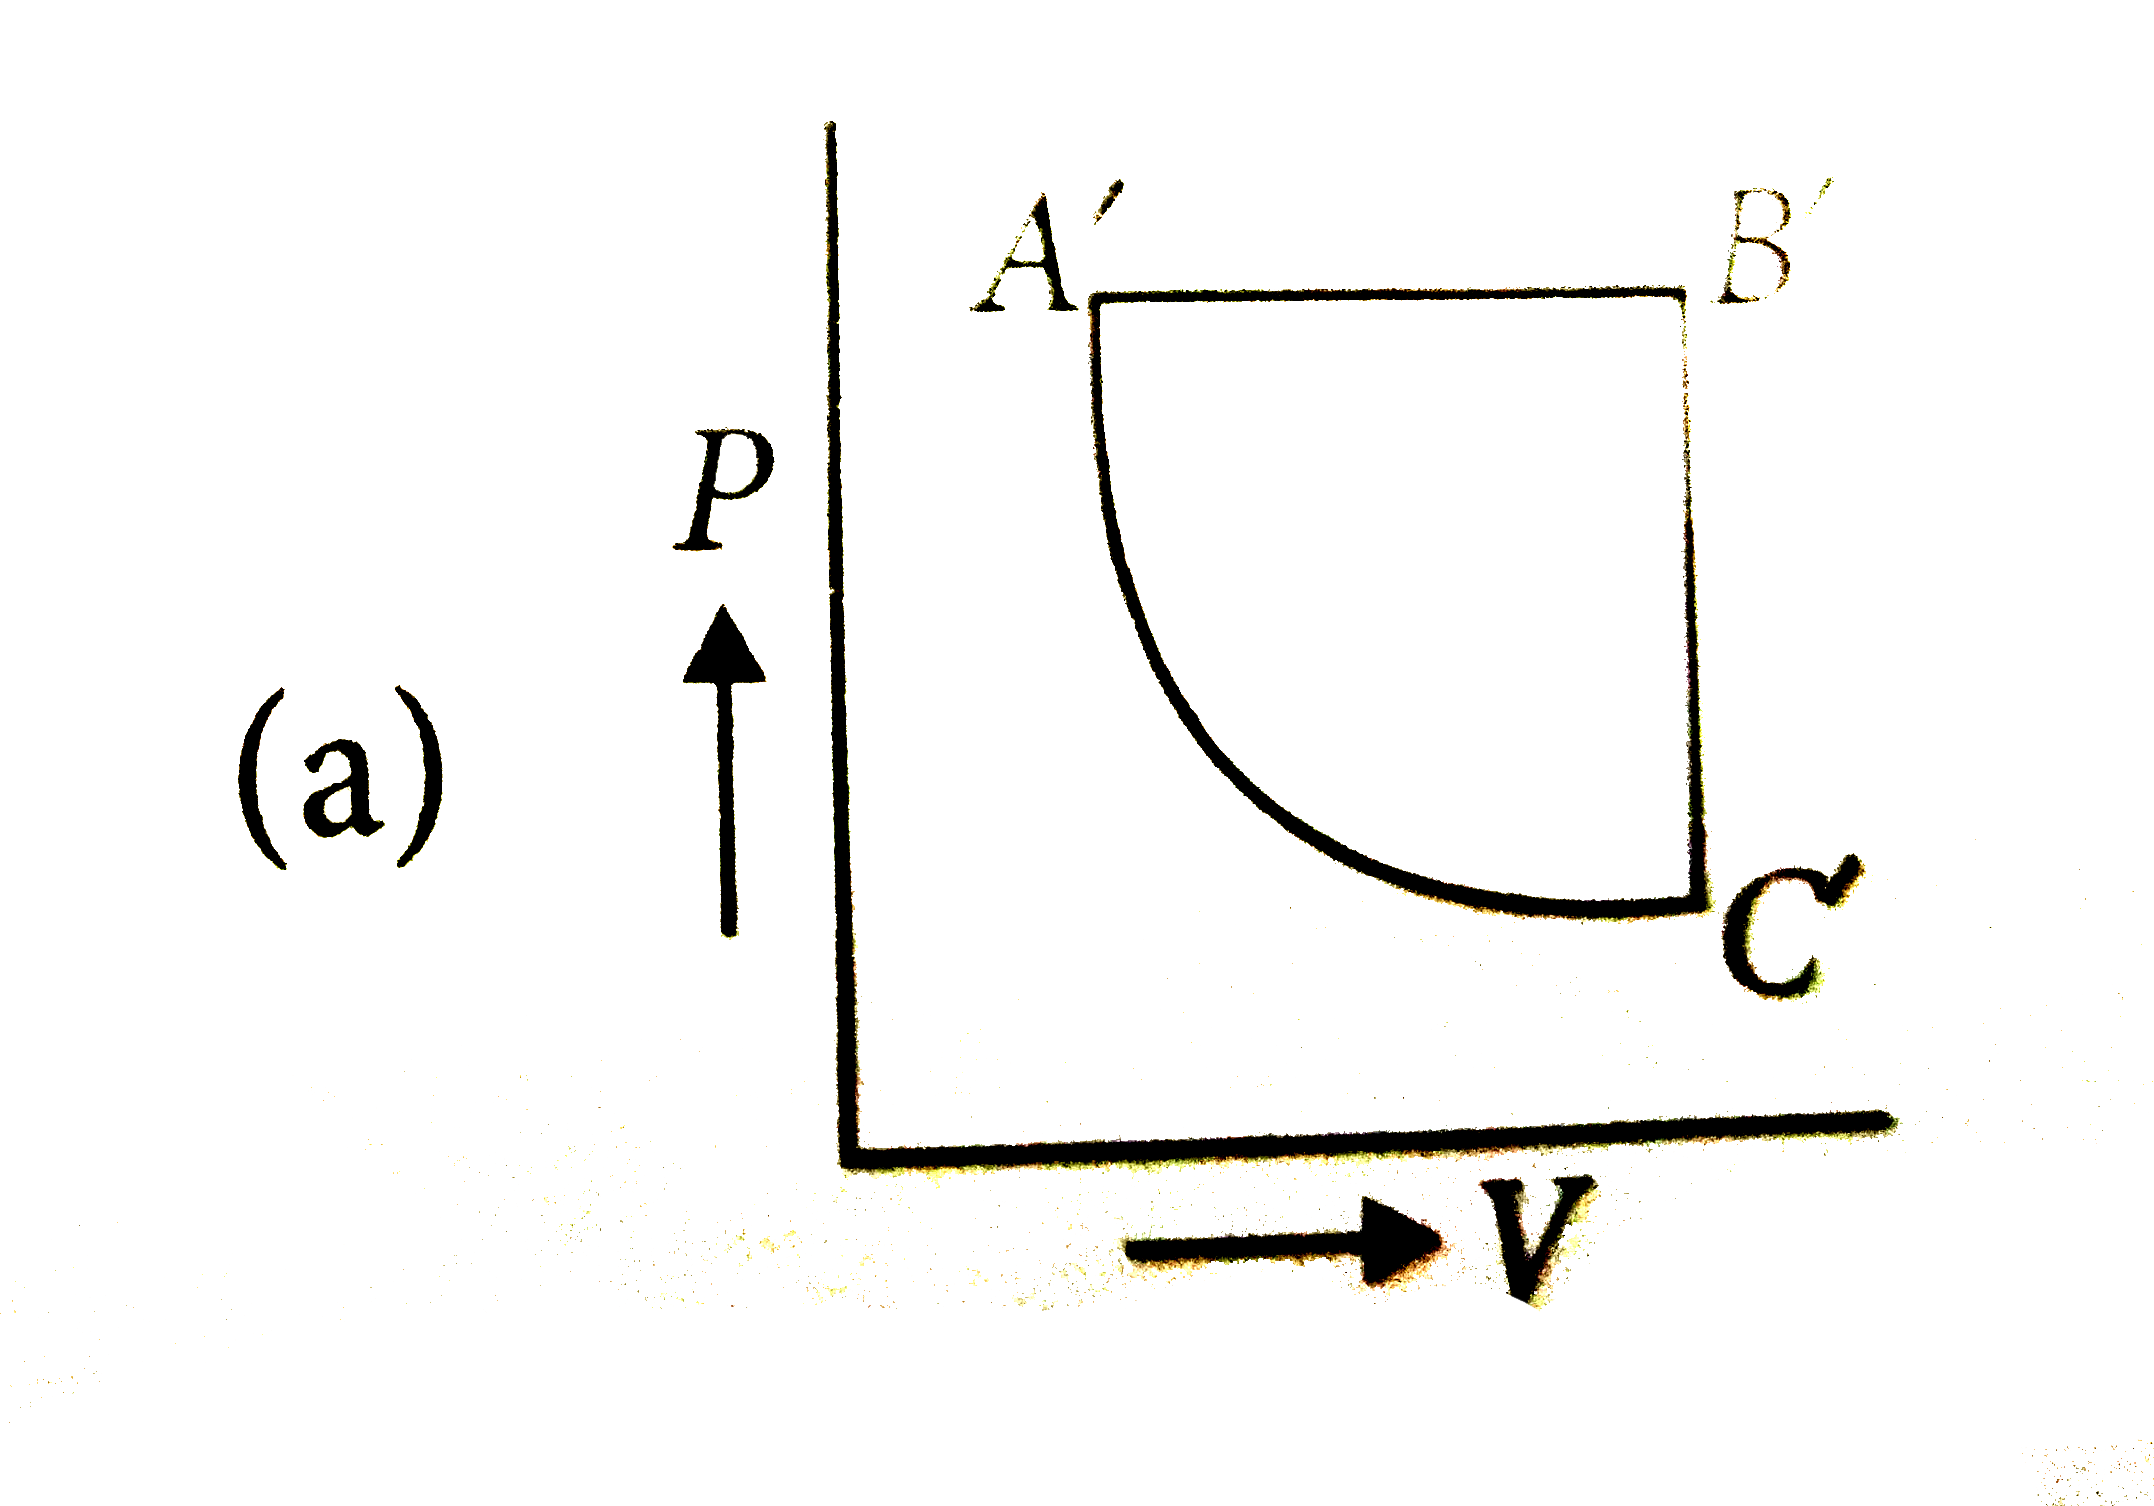 B
B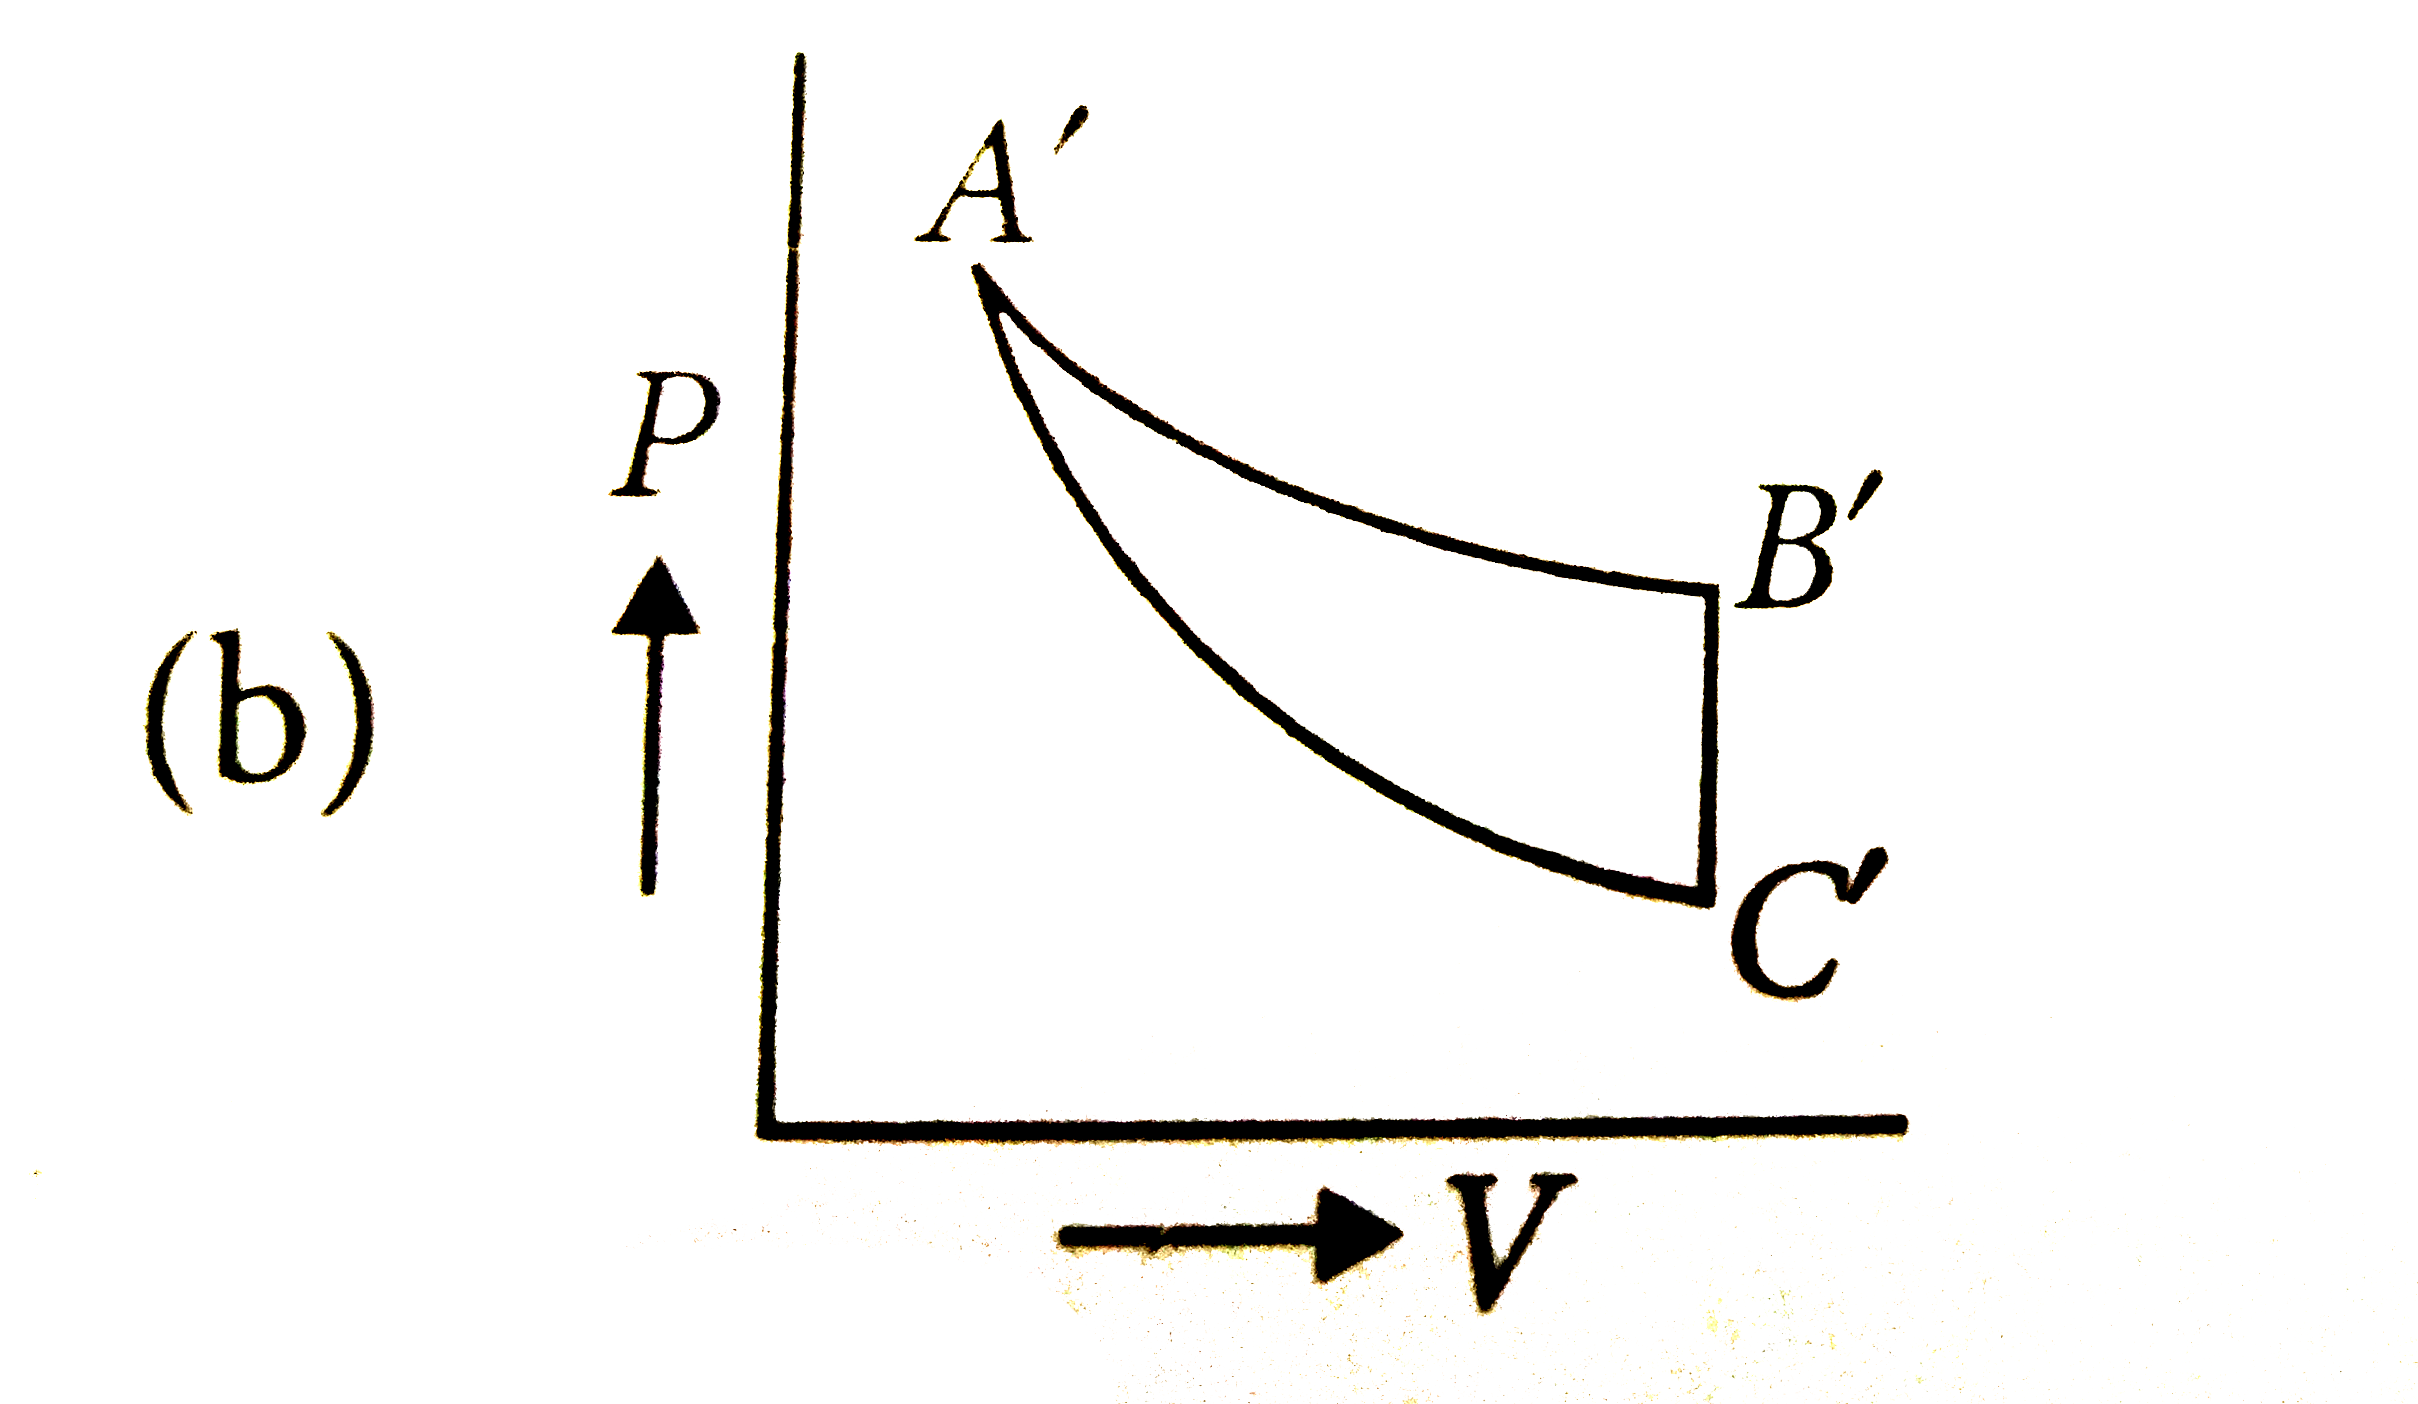 C
C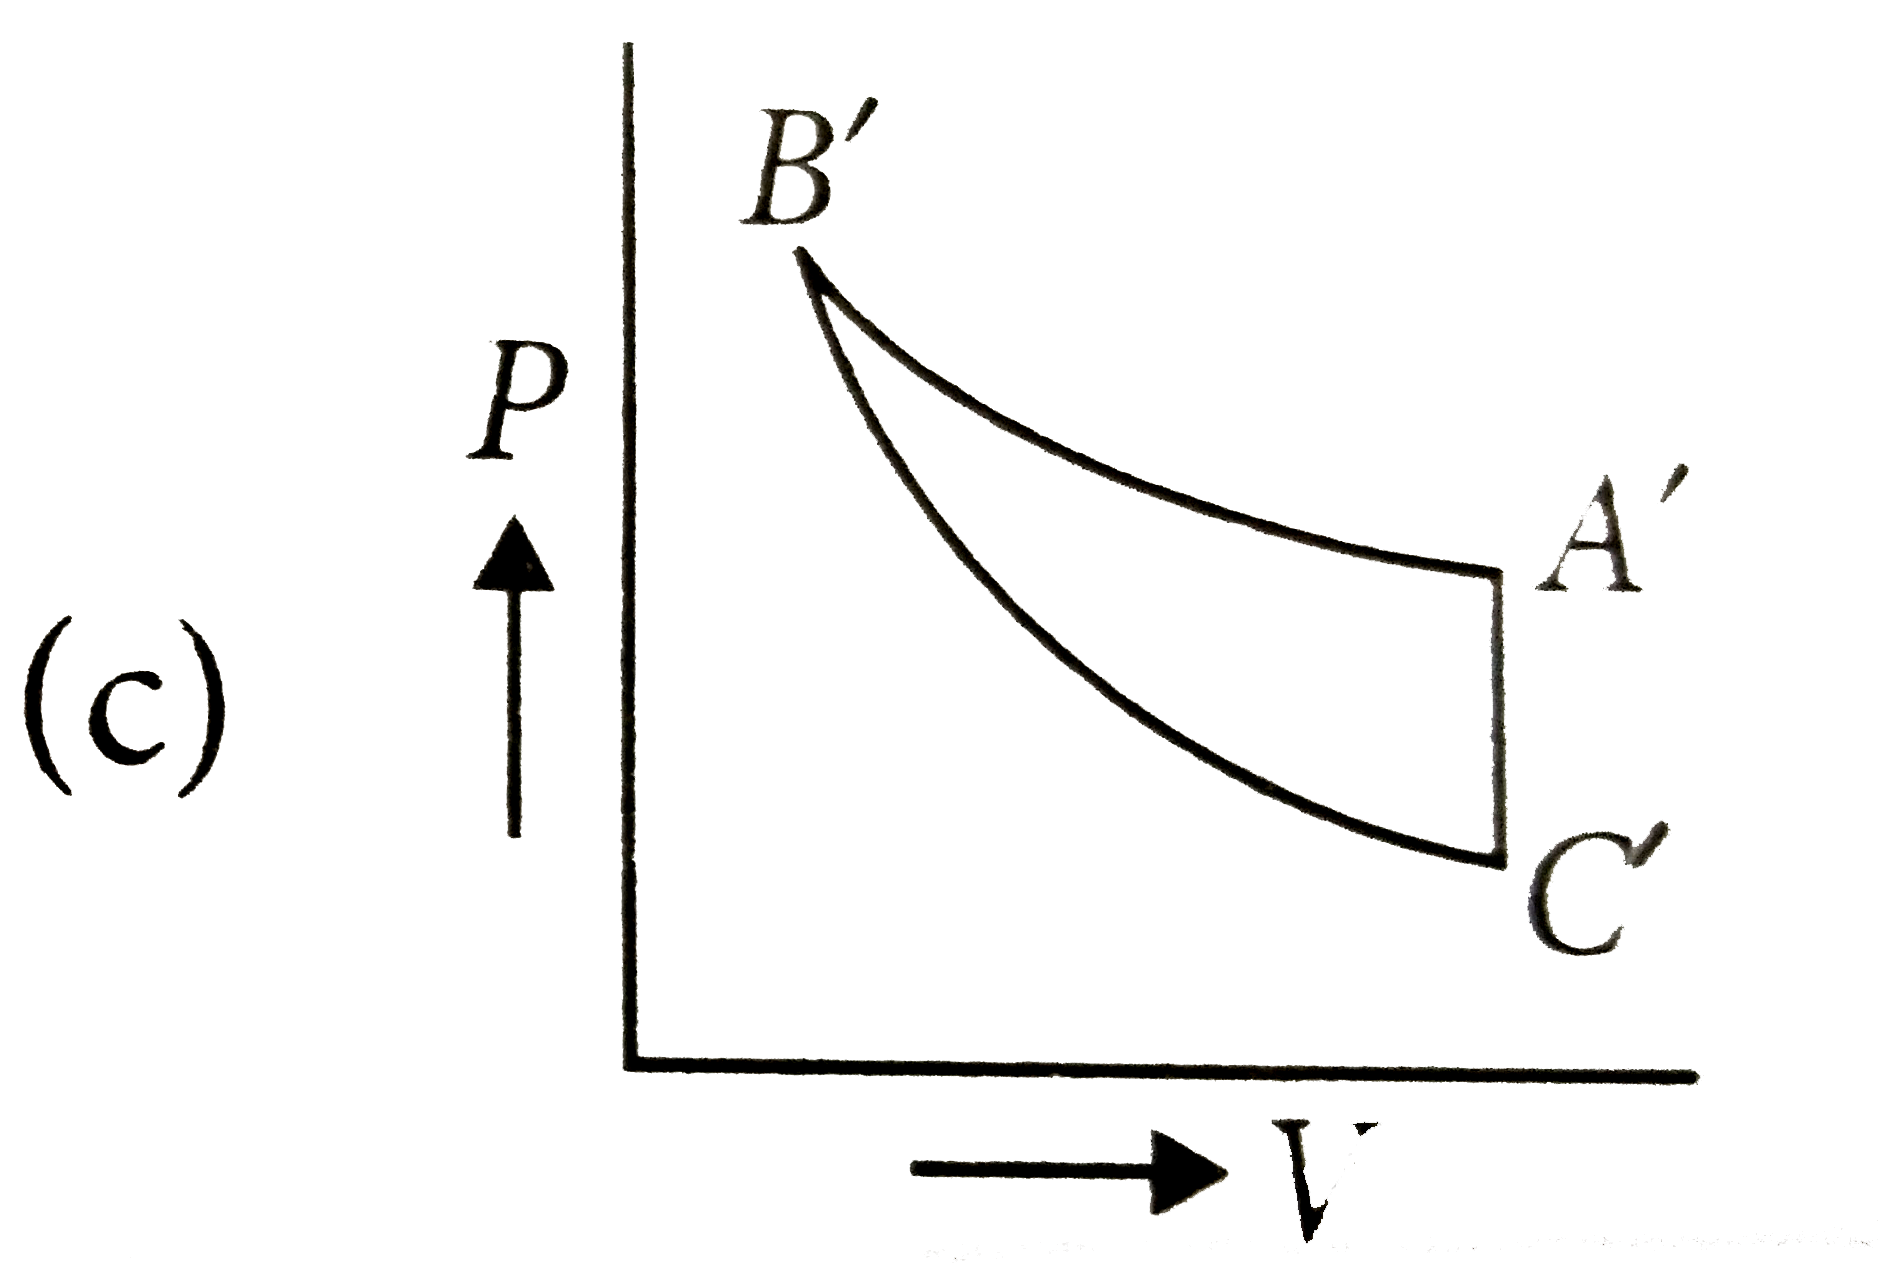 D
D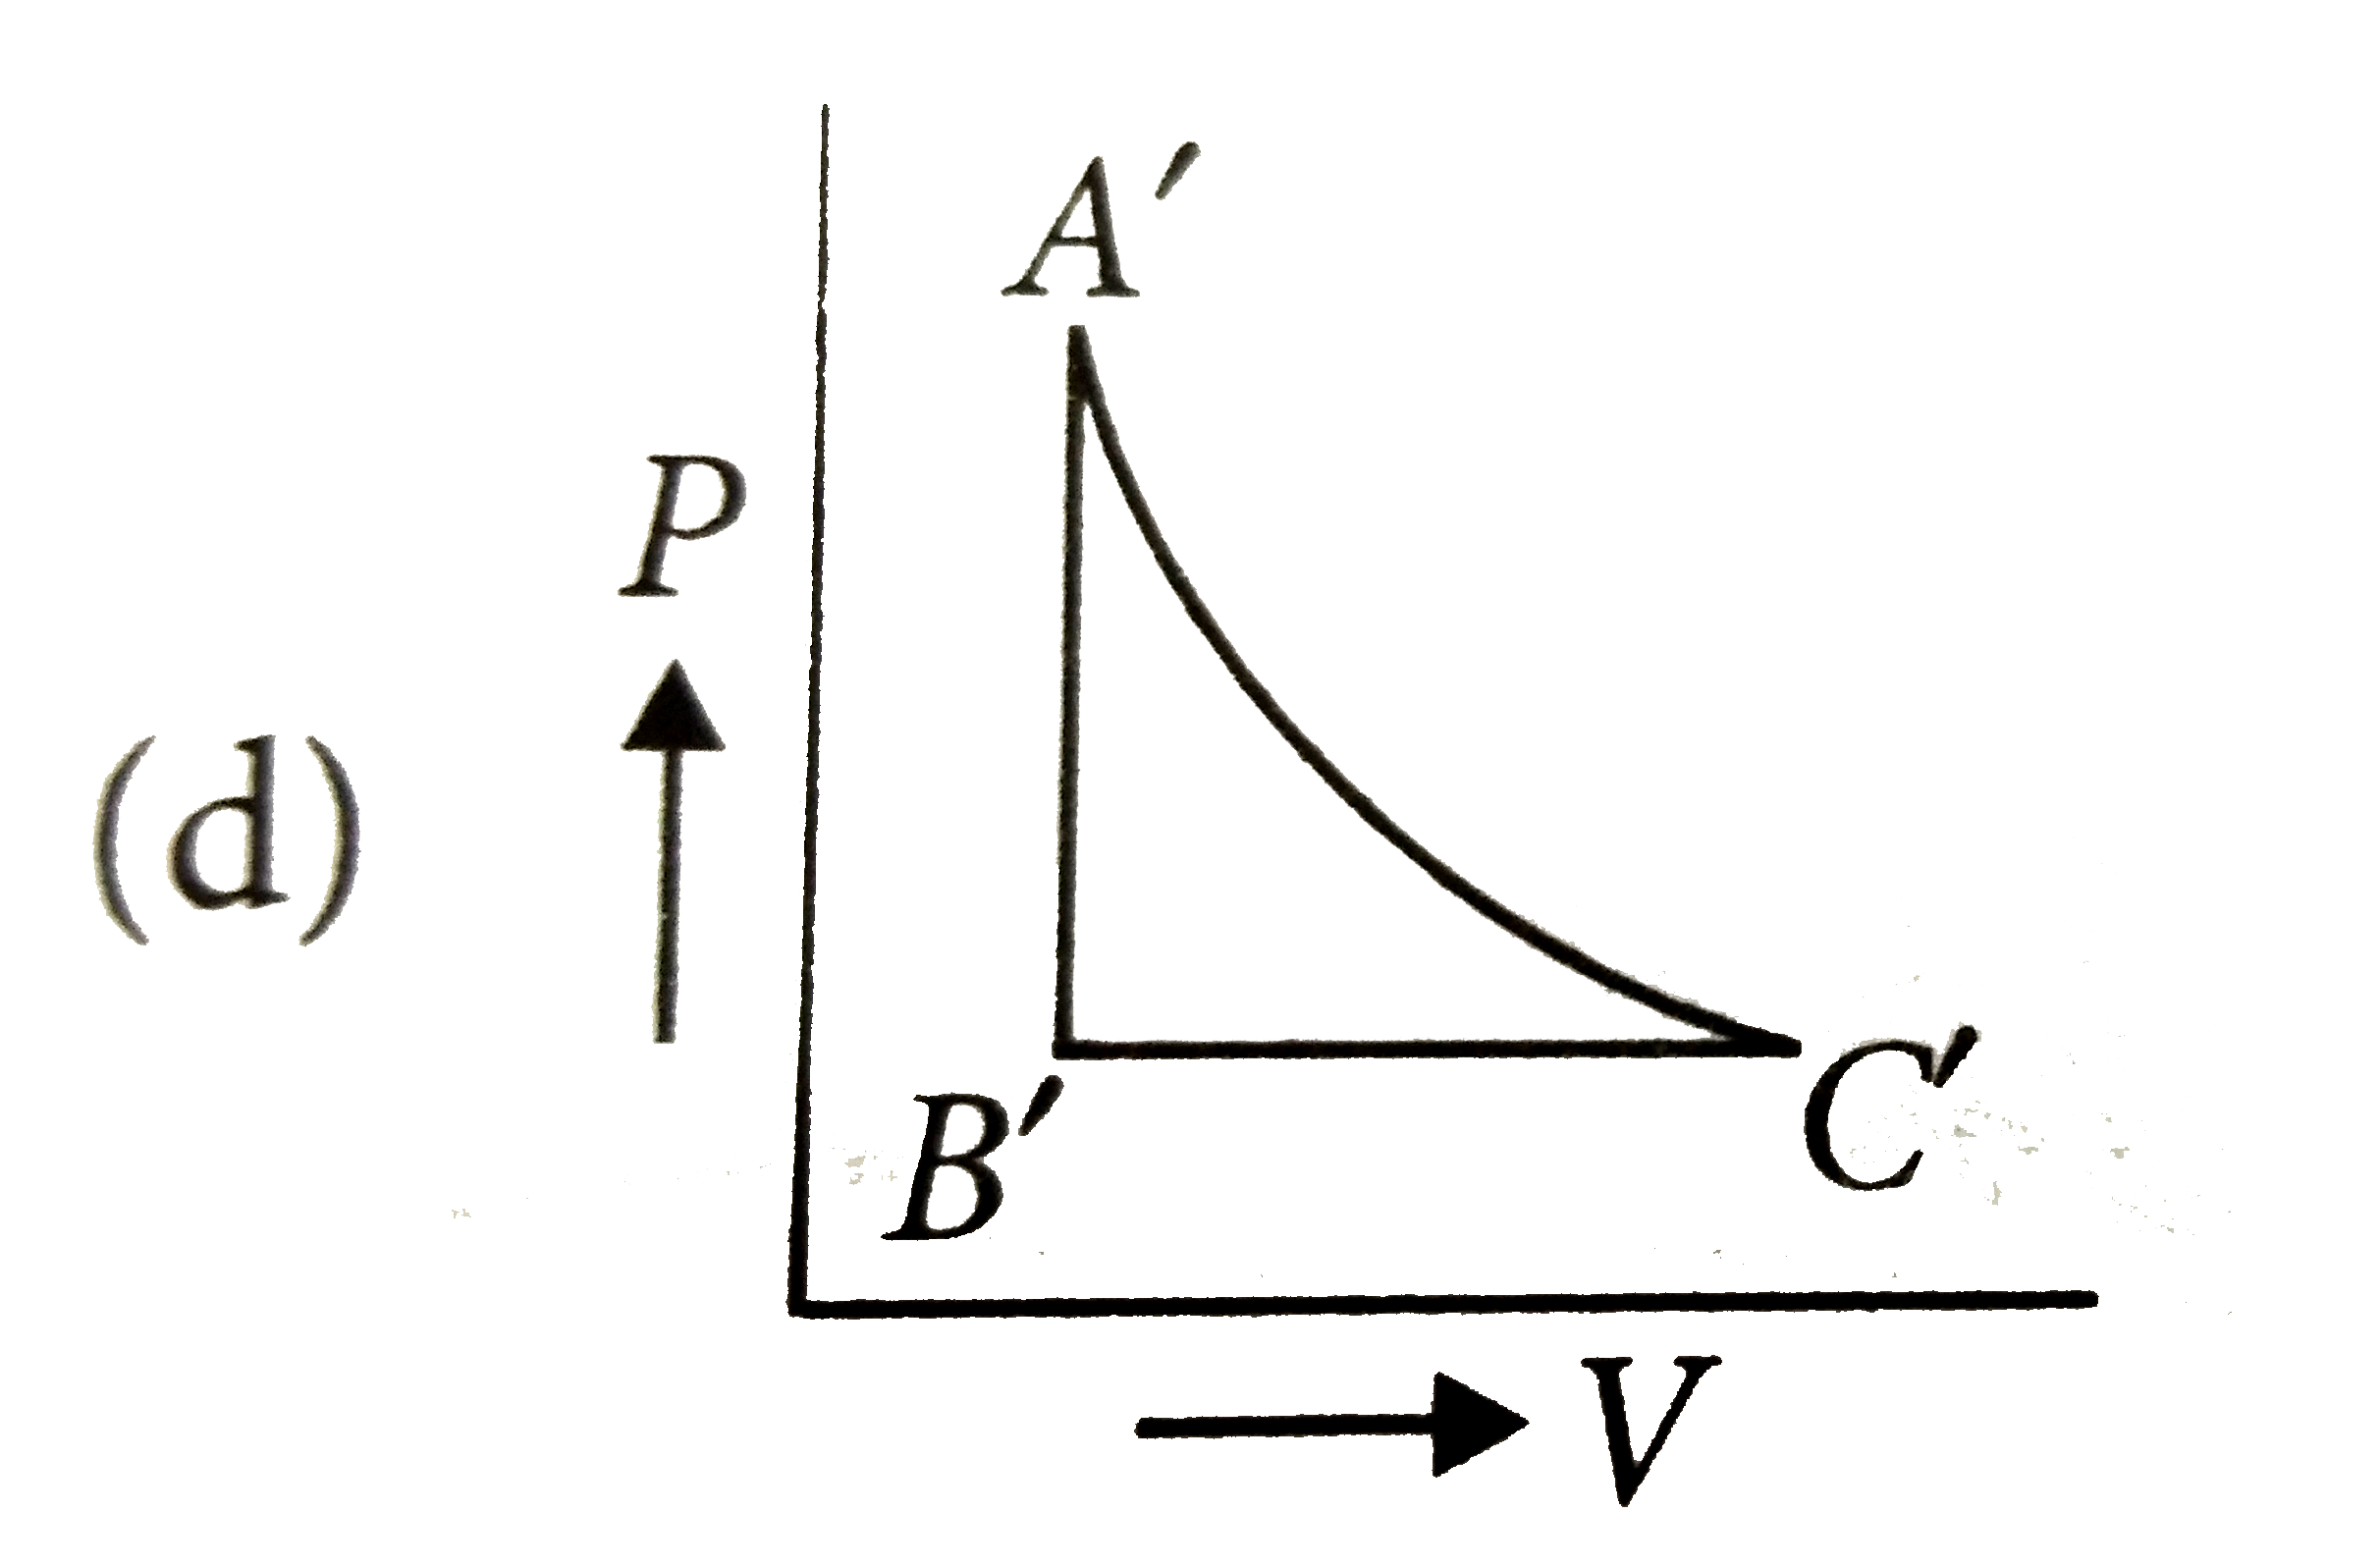
A thermodynamical system undergoes cyclic process ABCDA as shown in figure work done by the system is
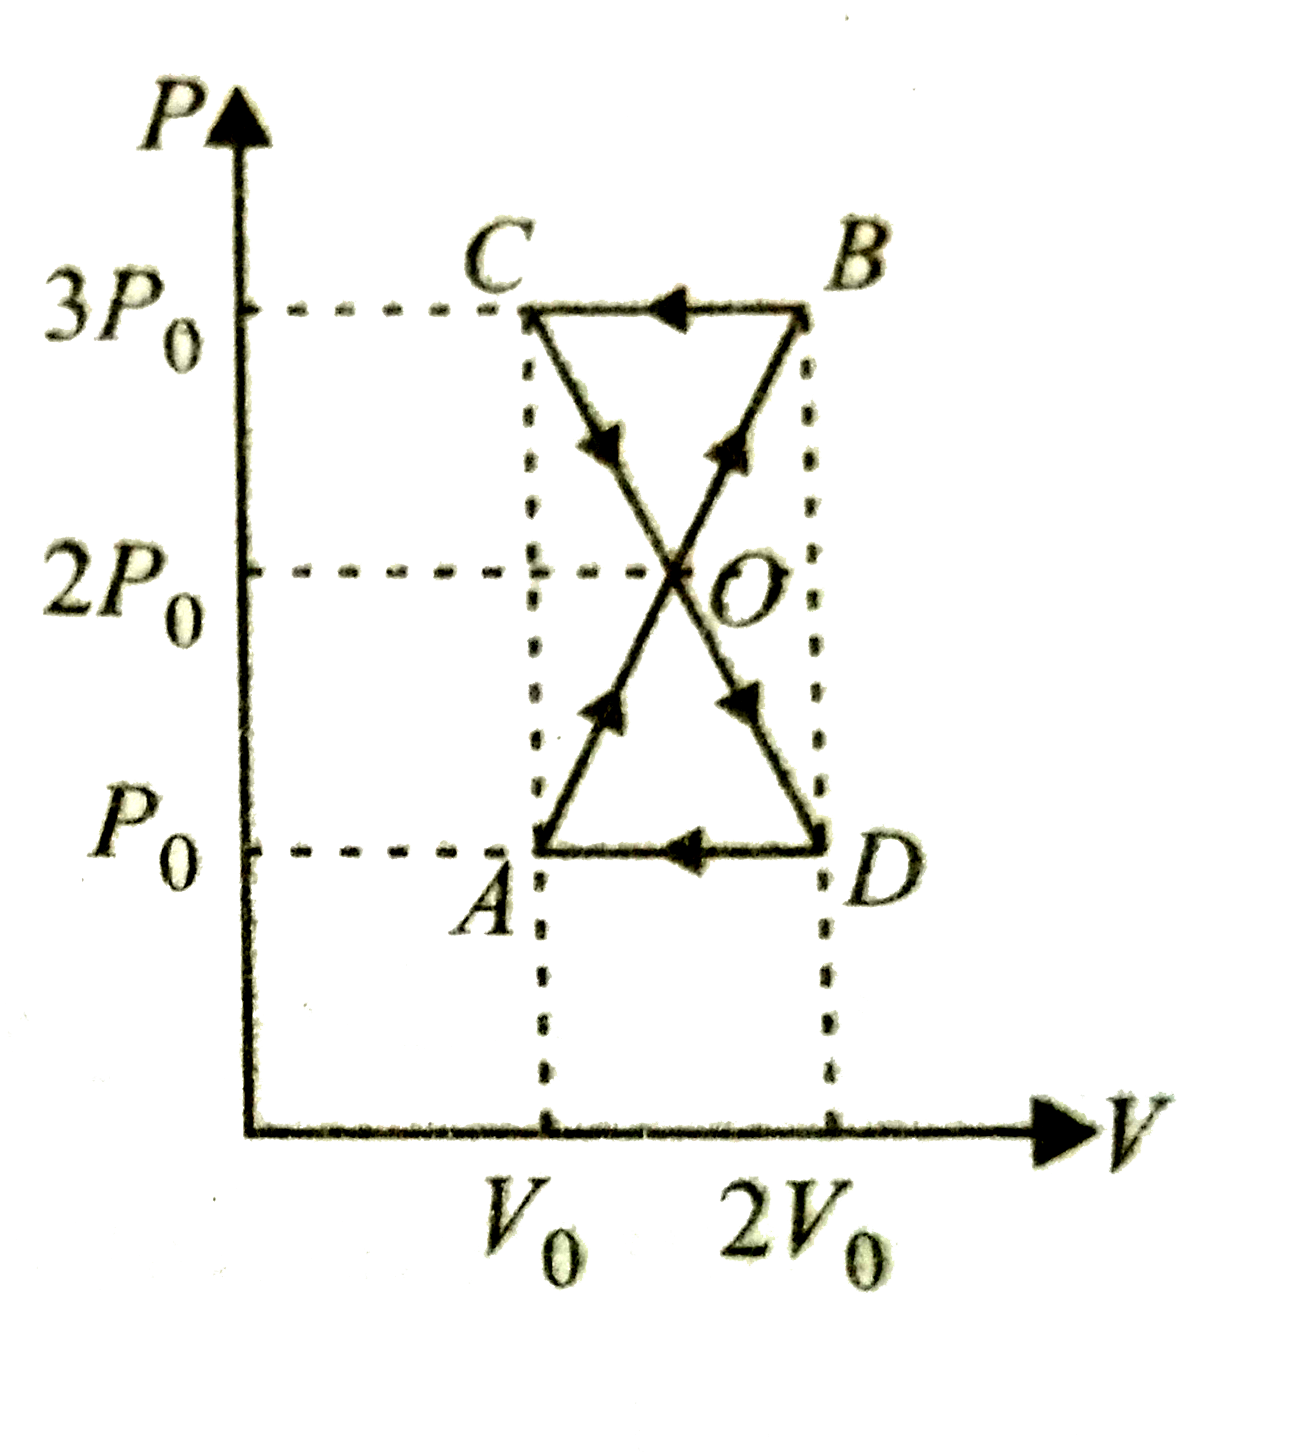 AZeroB2P0V0CP0V0D32P0V0
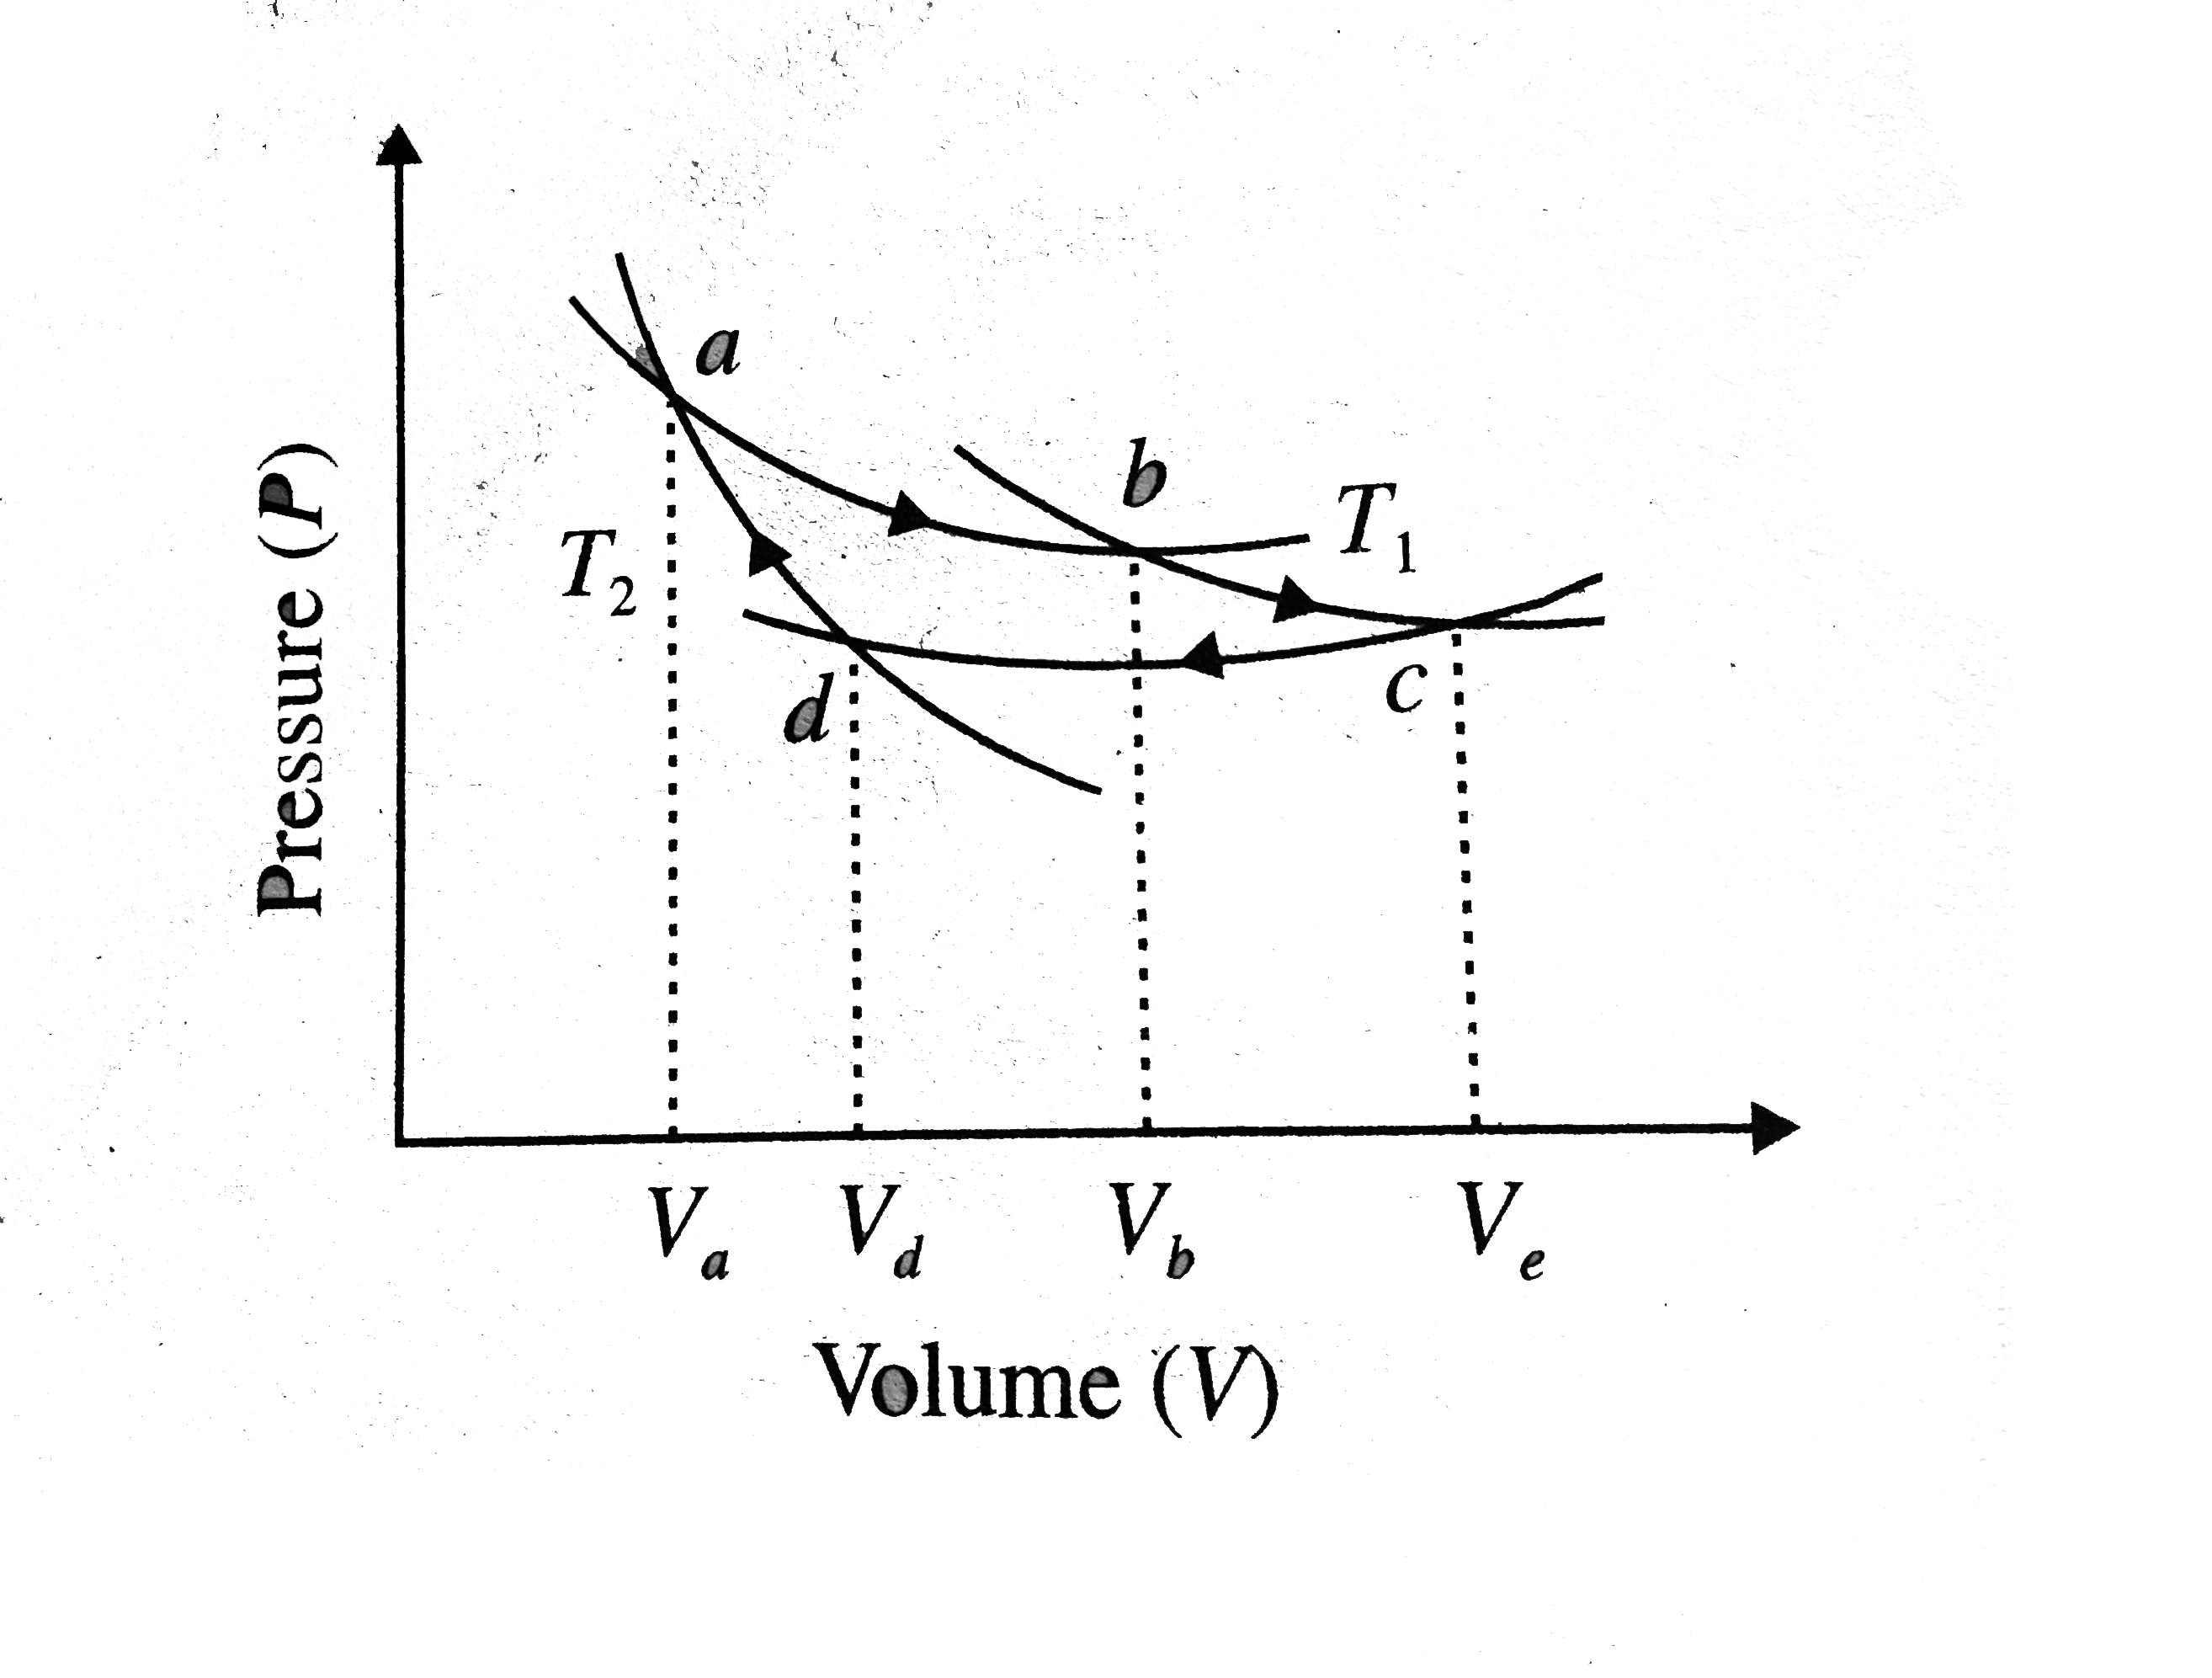
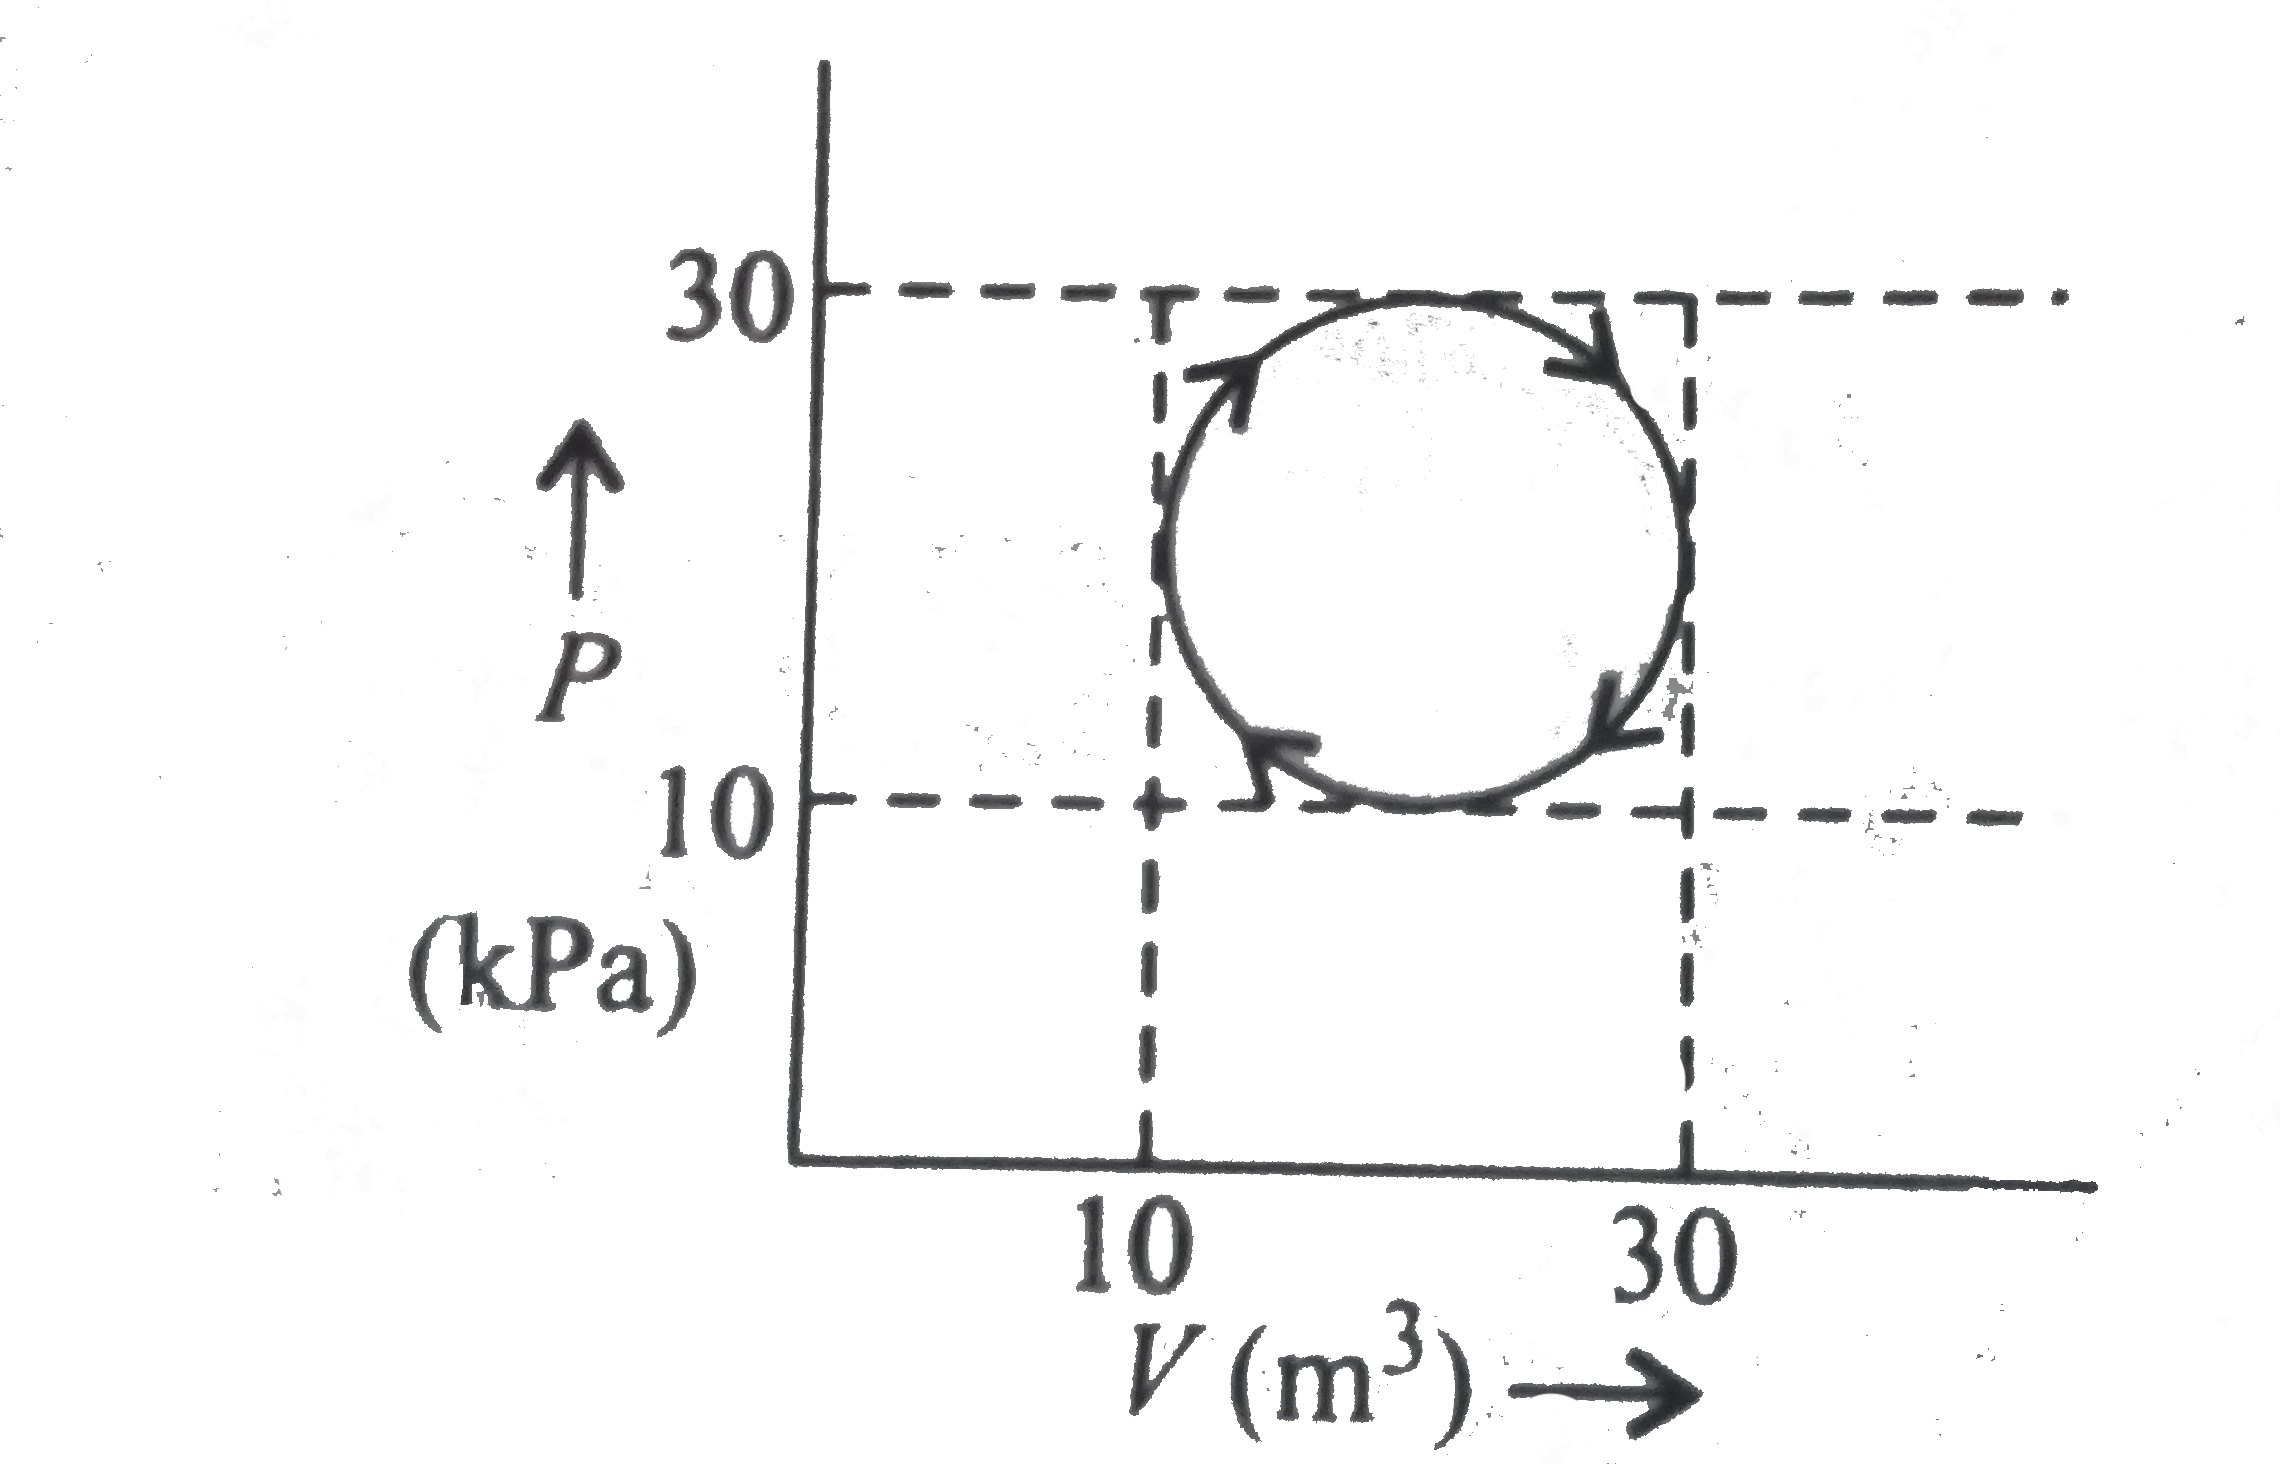
Which one is not correct for a cyclic process as shown in the figure ?
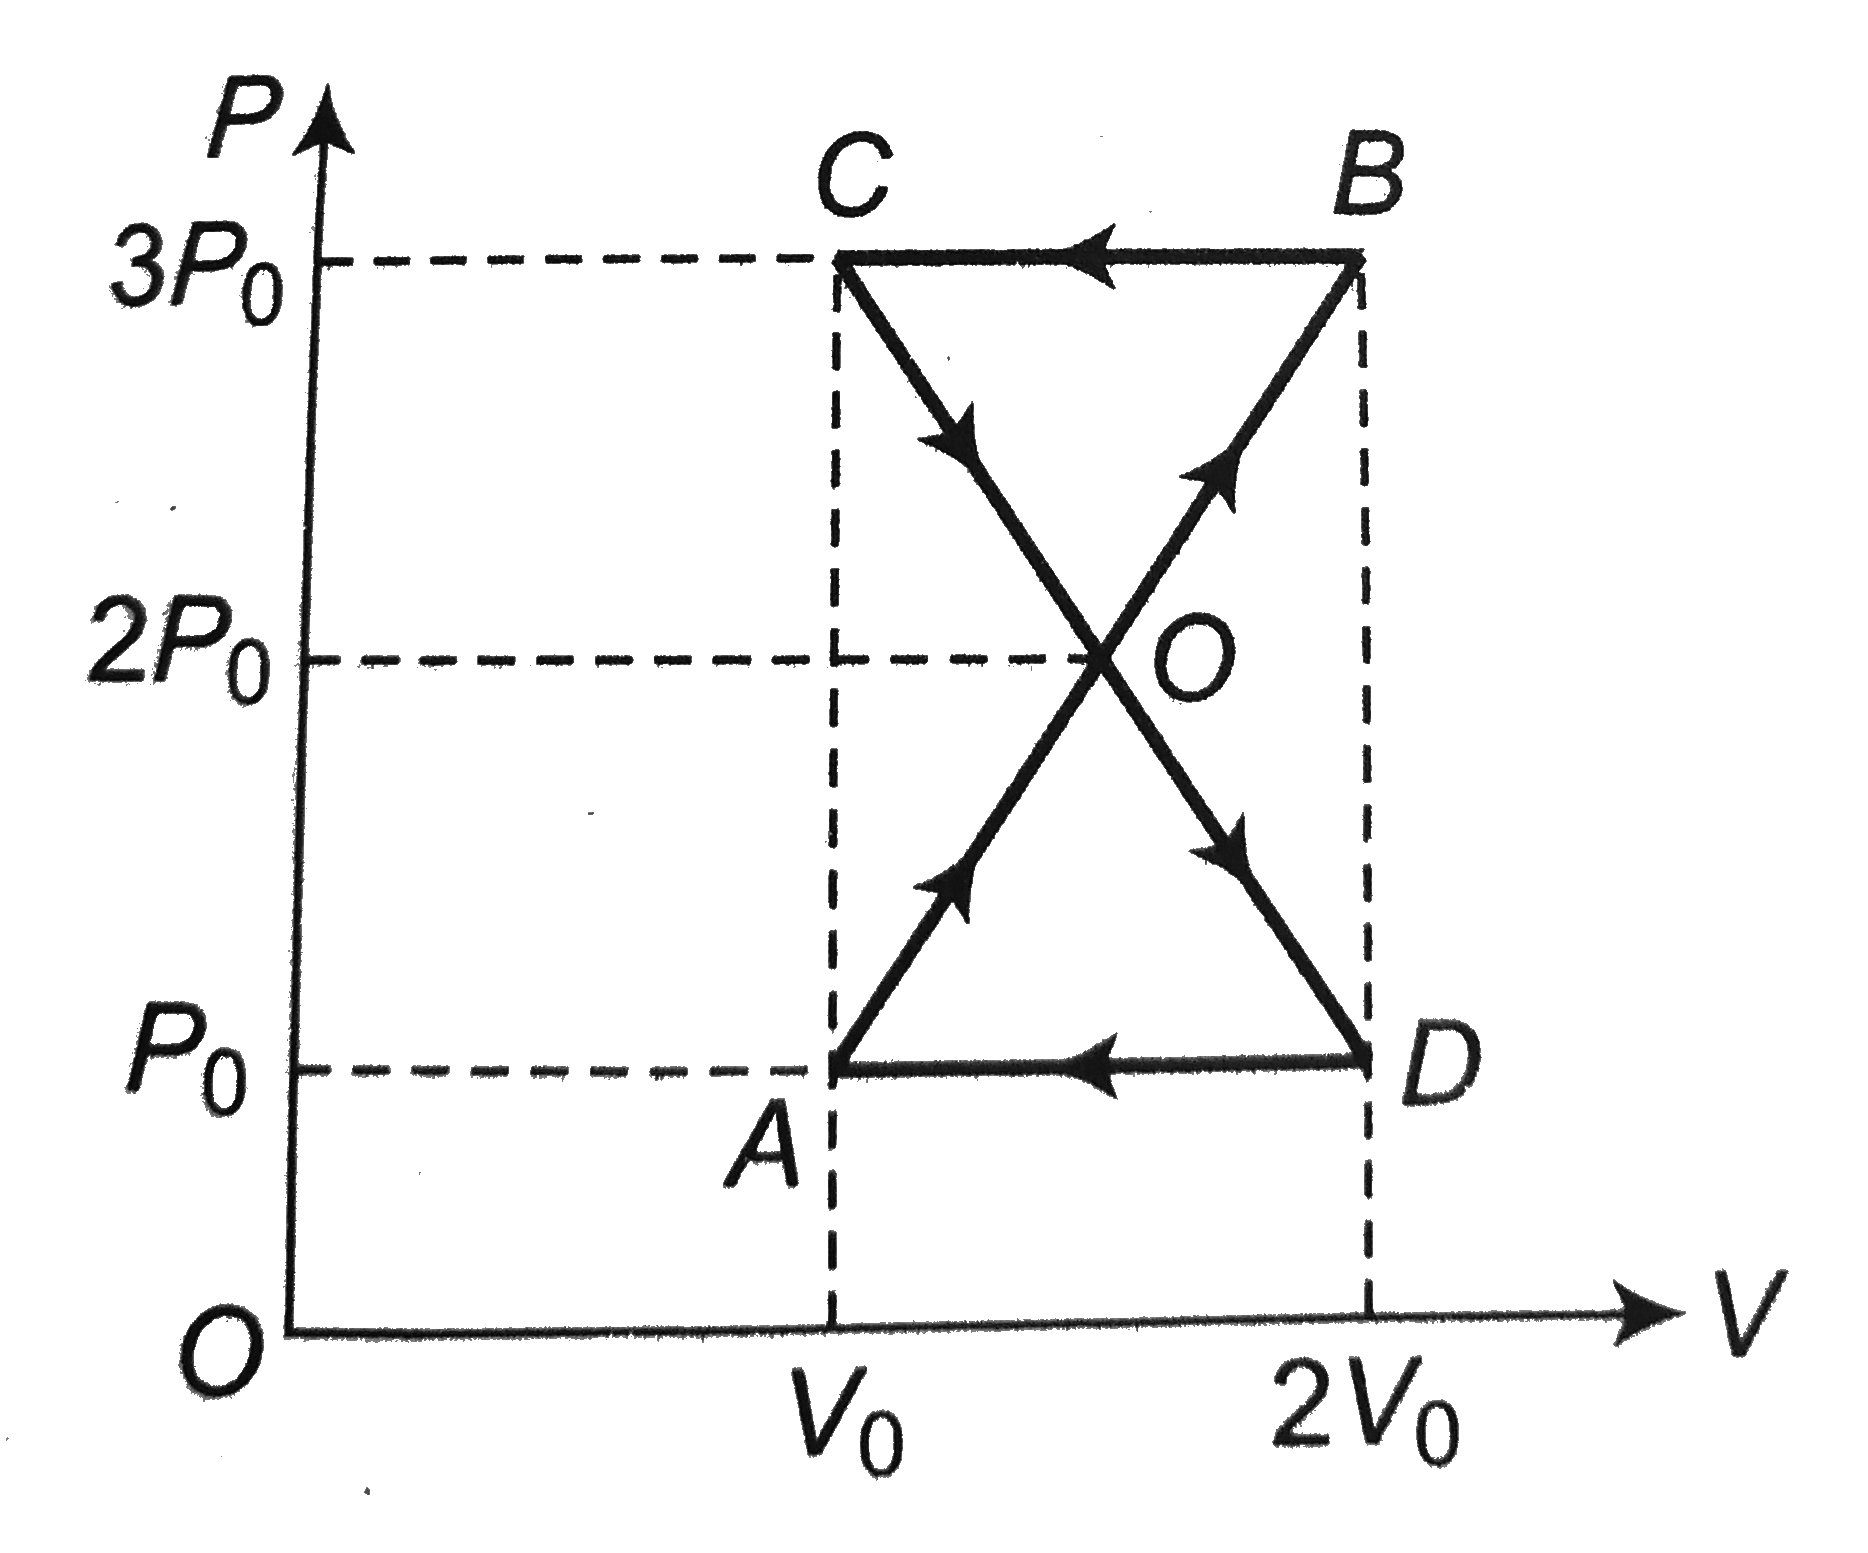
View SolutionA thermodynamic system undergoes cyclic process ABCDA as shown in figure. The work done by the system is
View SolutionAn ideal monatomic gas undergoes process PV1.25 = constant .Then
View Solution2 moles of an ideal monoatomic gas undergoes a cyclic process ABCA as shown in the figure. R is the univers l gas constant. (given ln 2=0.693) Answer the following questions
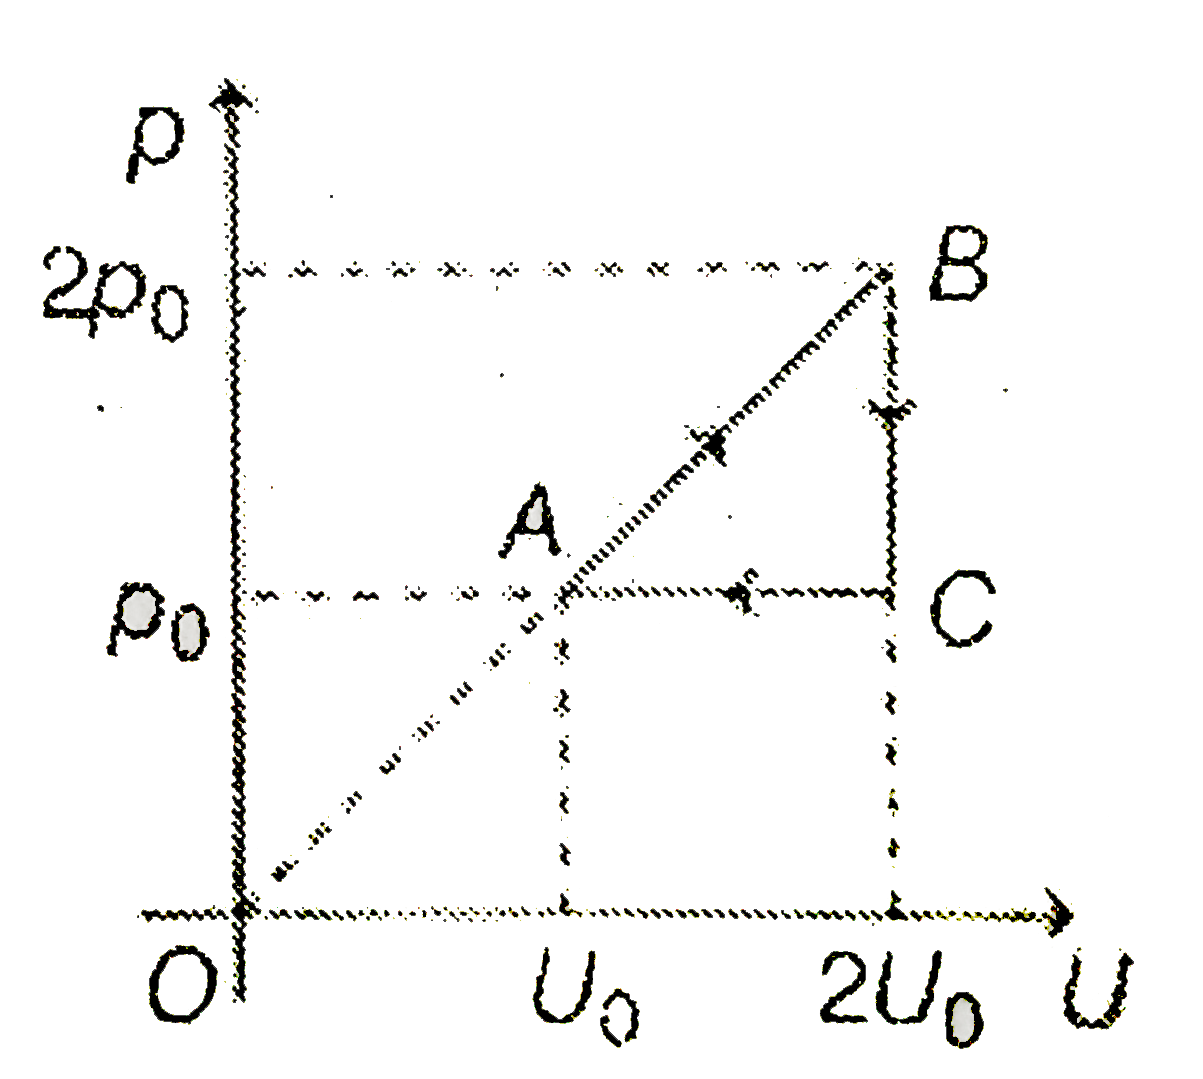
Graph of pressure versus volume of the cyclic process ABCA is
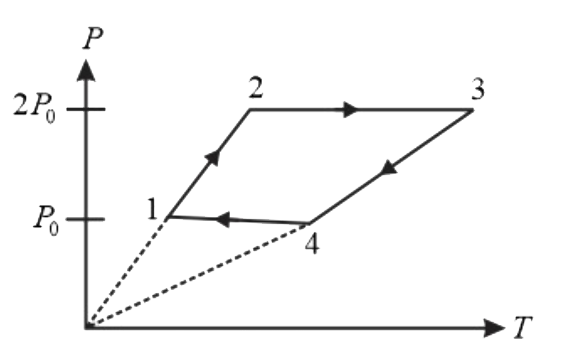
View SolutionOne mole of an ideal monoatomic gas undergoes a cyclic process, as shown in the figure. If the temperature of the gas at state 1 is 300 K and at state 4 is 500 K, then heat exchanged during process 2→3, is
View SolutionOne mole of an ideal gas in initial state A undergoes a cyclic process ABCA, as shown in the figure. Its pressure at A is P0. Choose the correct option (s) from the following
View Solution

