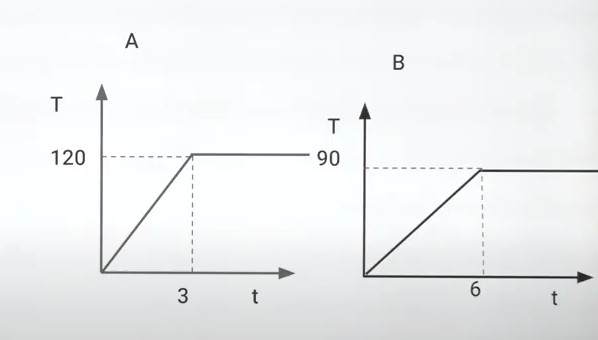
Temperature vs. time graphs are given below for 2 substances. Compare specific heat capacity 
A
SA>SB
B
SB>SA
C
SA=SB
D
Can't be determined
Video Solution
|
Answer
Step by step video & image solution for Temperature vs. time graphs are given below for 2 substances. Compare specific heat capacity by Physics experts to help you in doubts & scoring excellent marks in Class 12 exams.
Updated on:21/07/2023Topper's Solved these Questions
- JEE MAIN 2021BOOK - JEE MAINS PREVIOUS YEARCHAPTER - JEE MAIN 2021EXERCISE - SECTION-A
80 Videos
- JEE MAIN 2021BOOK - JEE MAINS PREVIOUS YEARCHAPTER - JEE MAIN 2021EXERCISE - SECTION-B
40 Videos
- JEE MAINBOOK - JEE MAINS PREVIOUS YEARCHAPTER - JEE MAINEXERCISE - All Questions
473 Videos
- JEE MAIN 2022BOOK - JEE MAINS PREVIOUS YEARCHAPTER - JEE MAIN 2022EXERCISE - Question
492 Videos
Similar Questions
Knowledge Check
The specific heat capacity is
Aconstant for each materialBdepends on the conditions under which it is measuredCsame for a material at all conditionsDthe statement 'a', 'b' and 'c' are correctThe specific heat capacity of water is
Amore than petrol and keroseneBless than oil and petrolCless than keroseneDless than honey and oilThe specific heat capacity of water is
Amore than petrol and keroseneBless than oil and petrolCless than keroseneDless than honey and oil
