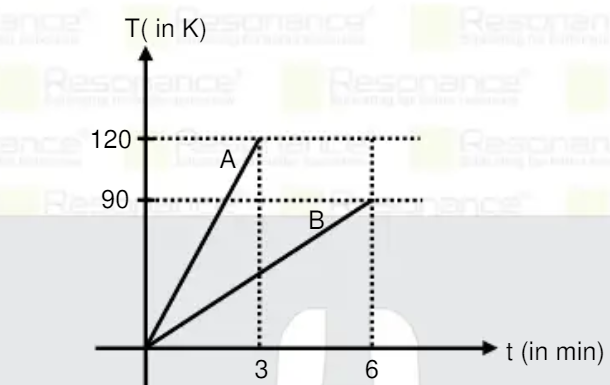
The temperature vs time graph for two different gases A and B having same number of moles is as shown in figure. If heat is supplied by same rate to both the gases. Find ratio of specific heat capacity of both gases. 
Step by step video & image solution for The temperature vs time graph for two different gases A and B having same number of moles is as shown in figure. If heat is supplied by same rate to both the gases. Find ratio of specific heat capacity of both gases. by Physics experts to help you in doubts & scoring excellent marks in Class 12 exams.
Updated on:21/07/2023Topper's Solved these Questions
- JEE MAIN 2021BOOK - JEE MAINS PREVIOUS YEARCHAPTER - JEE MAIN 2021EXERCISE - SECTION-A
80 Videos
- JEE MAIN 2021BOOK - JEE MAINS PREVIOUS YEARCHAPTER - JEE MAIN 2021EXERCISE - SECTION-B
40 Videos
- JEE MAINBOOK - JEE MAINS PREVIOUS YEARCHAPTER - JEE MAINEXERCISE - All Questions
473 Videos
- JEE MAIN 2022BOOK - JEE MAINS PREVIOUS YEARCHAPTER - JEE MAIN 2022EXERCISE - Question
492 Videos
Similar Questions
Two different gases A and B are enclosed in two vessels at pressure P1 and P2 respectively. If temperature of both the gases is the same, what will be the ratio of average KE/molecule of the two gases ?
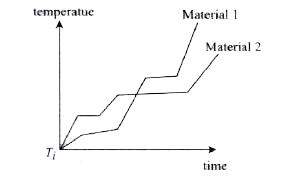
View SolutionTwo solid blocks having same mass but different material are supplied heat at a constant rate. They have same initial temperature. The graph between temperature and time is shown.

Answer the following questions on the basis of information given in the above statement.
Which material has higher specific heat capacity in gaseous state?
View Solution
Knowledge Check
At the same temperature and pressure , equal volumes of different gases contain the same number of
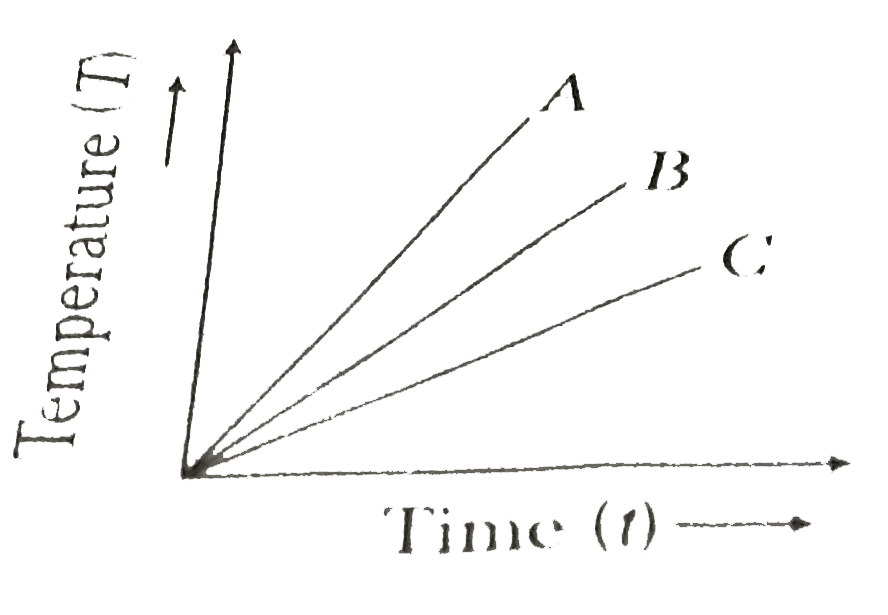
AelectronsBprotonsCmoleculesDnucleiThe temperatures versus time graph is shown in figure. Which of the substance A,B and C has the lowest heat capacity if heat is supplied to all of them at equal rates.
 AABBCCDAll the above
Different gases at the same temperature must have
ASame volumeBSame pressureCSame average KEDSame vander Wall's constant
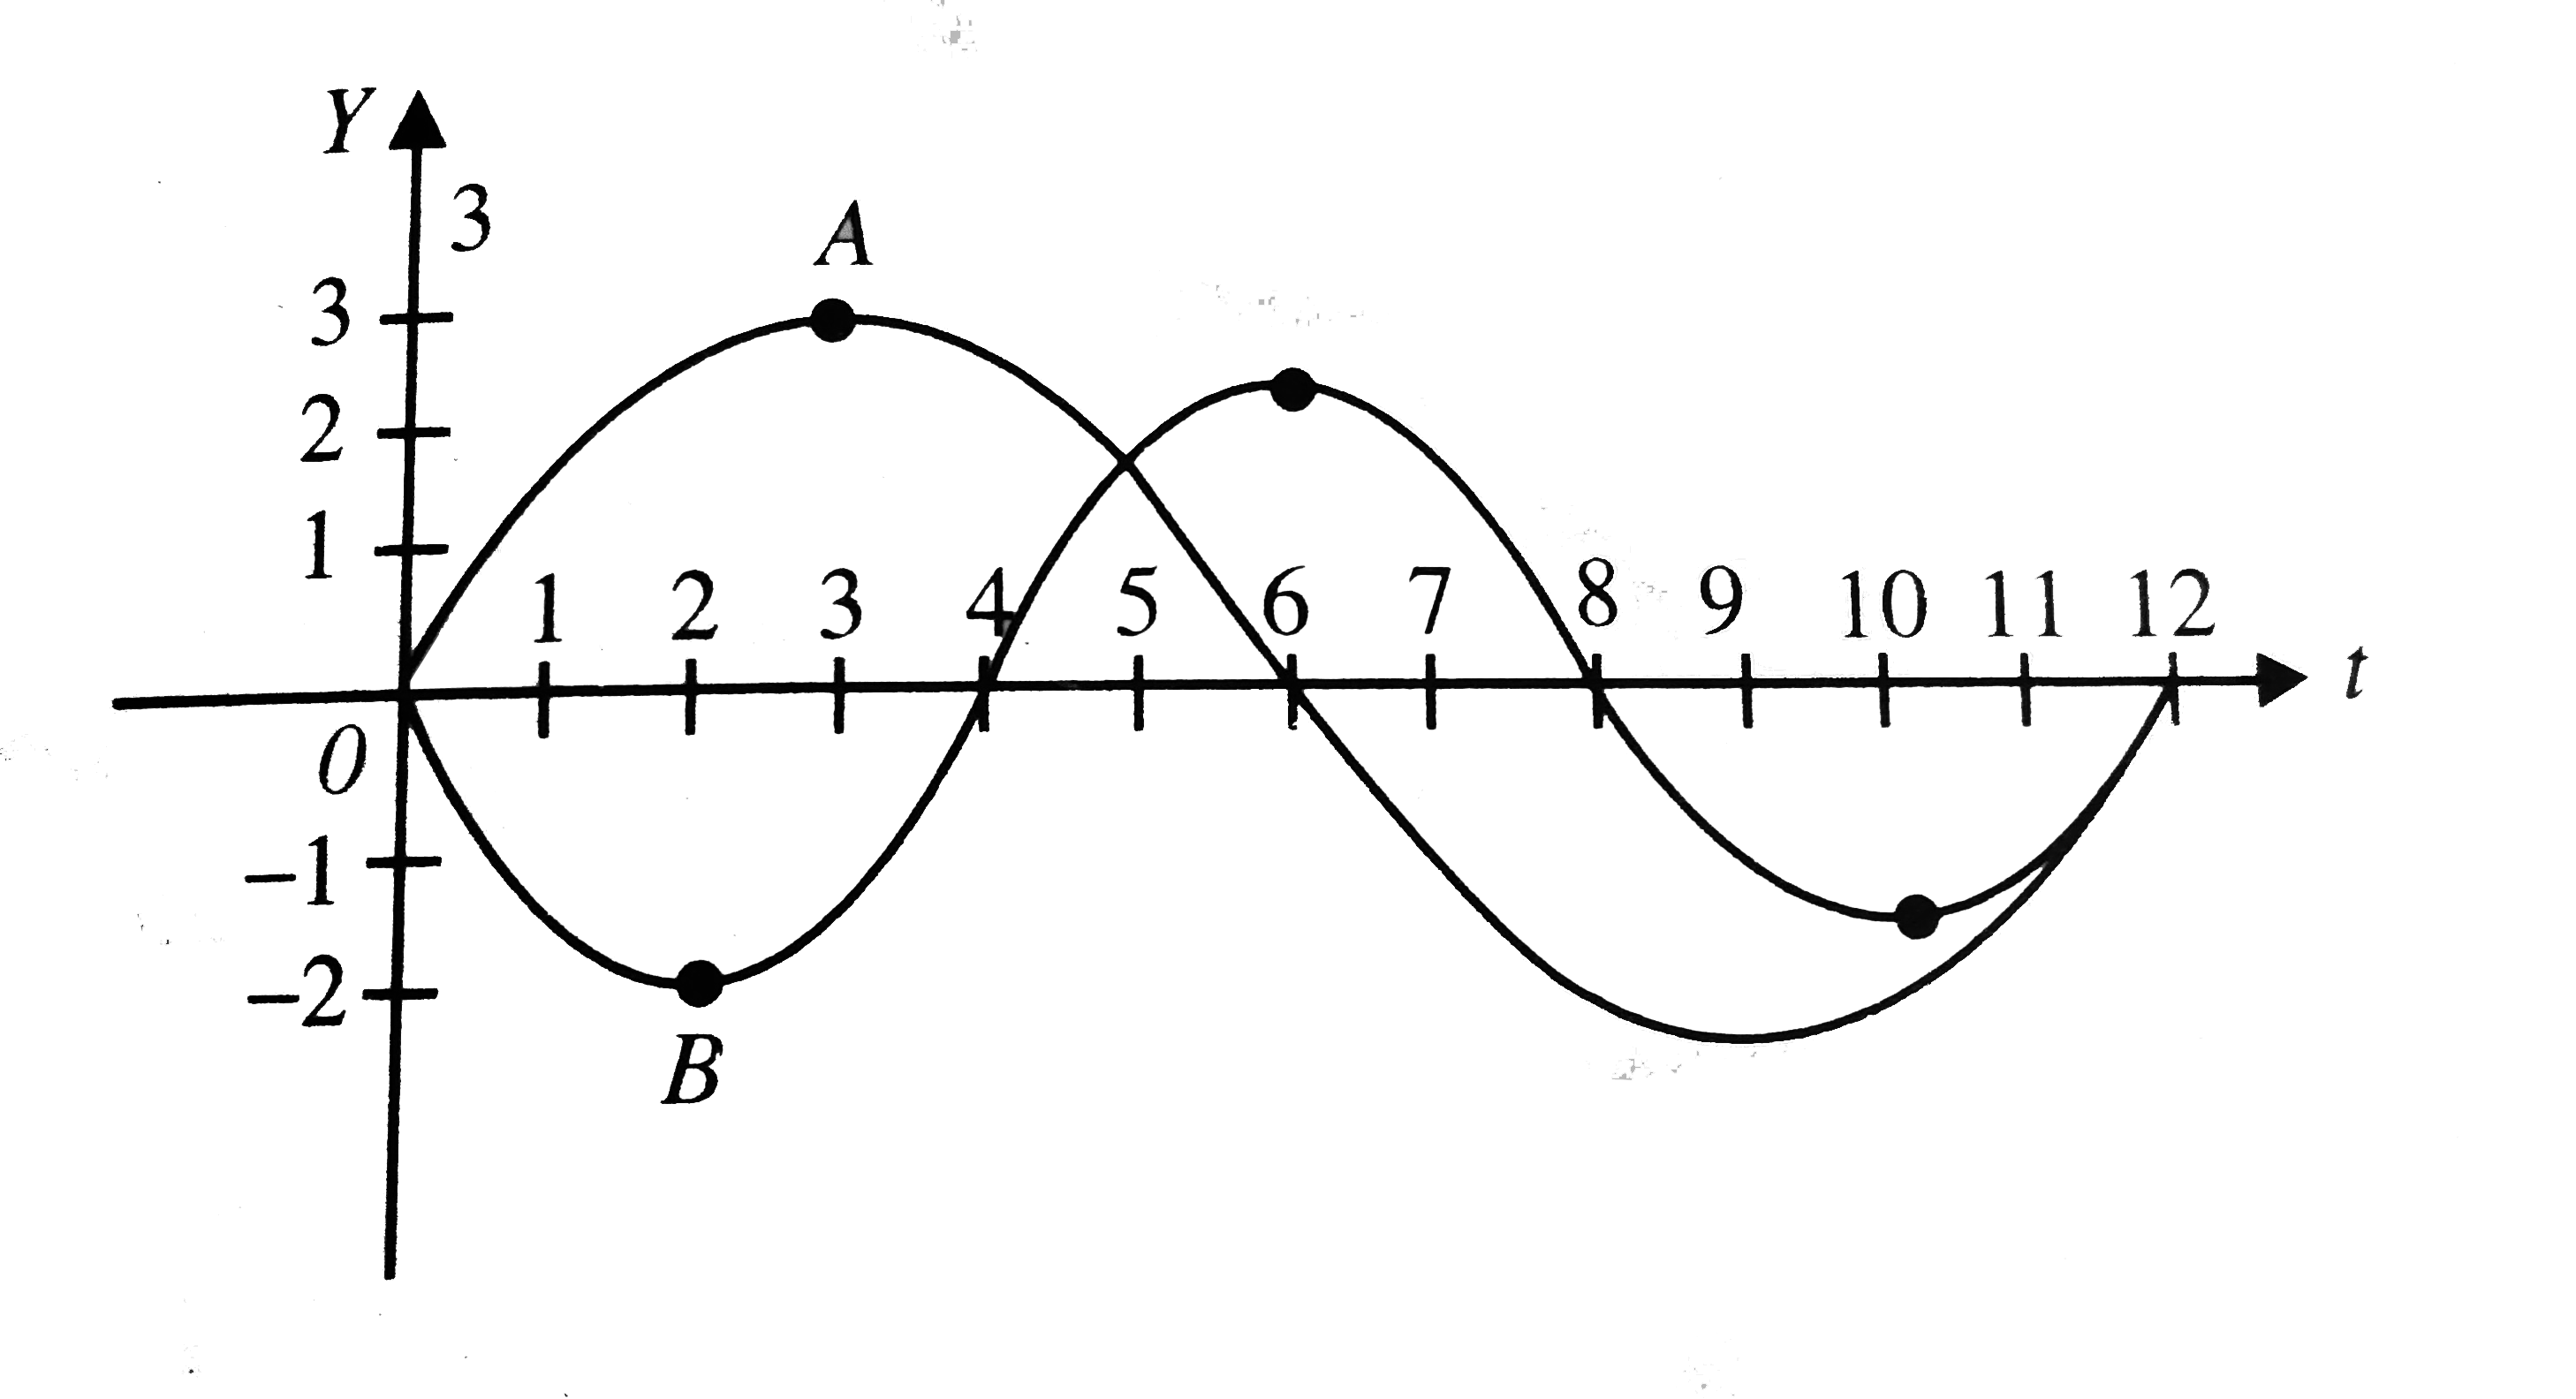
The displacement vs time graph for two waves A and B which travel along the same string arre shown in the figure. Their intensity ratio IA∣IB is

View SolutionUnder the same conditions, two gases have the same number of molecules. They must
View SolutionUnder the same conditions, two gases have the same number of molecules. They must
View SolutionAt constant temperature of 273K,1V vs P are plotted for two ideal gases A and B as given below. Ratio of number of moles of A and B are:
View SolutionUnder the same conditions, two gases have the same number of molecules. They must:
View Solution
