Consider the following statements The appropriate number of classes while constructing a frequency distribution should be chosen such that1 The class frequency first increases to a peak and then declines. 2 The class-frequency should chuster around the class mid point Which of the statements given is/are correct?
1only
2only
Both 1 and 2
Neithe 1 nor 2
The correct Answer is:B
To determine the correctness of the given statements regarding the construction of a frequency distribution, let's analyze each statement step by step.
1. Understanding the Statements:
- Statement 1: The class frequency first increases to a peak and then declines.
- Statement 2: The class frequency should cluster around the class midpoint.
2. Analyzing Statement 1:
- In a frequency distribution, class frequencies can vary based on the data set. However, it is common for class frequencies to increase initially as more data points fall within the lower ranges, reach a peak, and then decline as fewer data points fall into the higher ranges.
- Conclusion: This statement can be true for certain distributions (like a normal distribution), but it is not a strict requirement for all frequency distributions. Hence, this statement is not universally correct.
3. Analyzing Statement 2:
- The class midpoint is calculated as the average of the lower and upper limits of each class interval. It is expected that the frequencies will cluster around these midpoints, especially in a well-structured frequency distribution.
- For example, if we have classes like 1-5, 6-10, and 11-15, the midpoints are 3, 8, and 13 respectively. If the data is distributed normally, we would expect more frequencies to be around these midpoints.
- Conclusion: This statement is correct as it reflects the general behavior of frequencies in a well-constructed frequency distribution.
4. Final Decision:
- Based on the analysis:
- Statement 1 is not universally correct.
- Statement 2 is correct.
- Therefore, the correct answer is that only Statement 2 is correct.
Final Answer:
Only Statement 2 is correct.
- Statement 1: The class frequency first increases to a peak and then declines.
- Statement 2: The class frequency should cluster around the class midpoint.
- In a frequency distribution, class frequencies can vary based on the data set. However, it is common for class frequencies to increase initially as more data points fall within the lower ranges, reach a peak, and then decline as fewer data points fall into the higher ranges.
- Conclusion: This statement can be true for certain distributions (like a normal distribution), but it is not a strict requirement for all frequency distributions. Hence, this statement is not universally correct.
- The class midpoint is calculated as the average of the lower and upper limits of each class interval. It is expected that the frequencies will cluster around these midpoints, especially in a well-structured frequency distribution.
- For example, if we have classes like 1-5, 6-10, and 11-15, the midpoints are 3, 8, and 13 respectively. If the data is distributed normally, we would expect more frequencies to be around these midpoints.
- Conclusion: This statement is correct as it reflects the general behavior of frequencies in a well-constructed frequency distribution.
- Based on the analysis:
- Statement 1 is not universally correct.
- Statement 2 is correct.
- Therefore, the correct answer is that only Statement 2 is correct.
Only Statement 2 is correct.
Topper's Solved these Questions
Similar Questions
Knowledge Check
- Question 1 - Select One
Consider the following statements :
The appropriate number of classes while constructing a frequency distribution should be chosen such that
1. the class-frequency that increases to a peak and then declines.
2. the class-frequency should cluster around the class mid point.
Which of the statements given is/are correct?A1 onlyB2 onlyCBoth 1 and 2DNeither 1 nor 2 - Question 2 - Select One
How many classes a frequency distribution should have?
ALarge numberBSmall numberCNeither very large nor very small numberDNot more than 10. - Question 3 - Select One
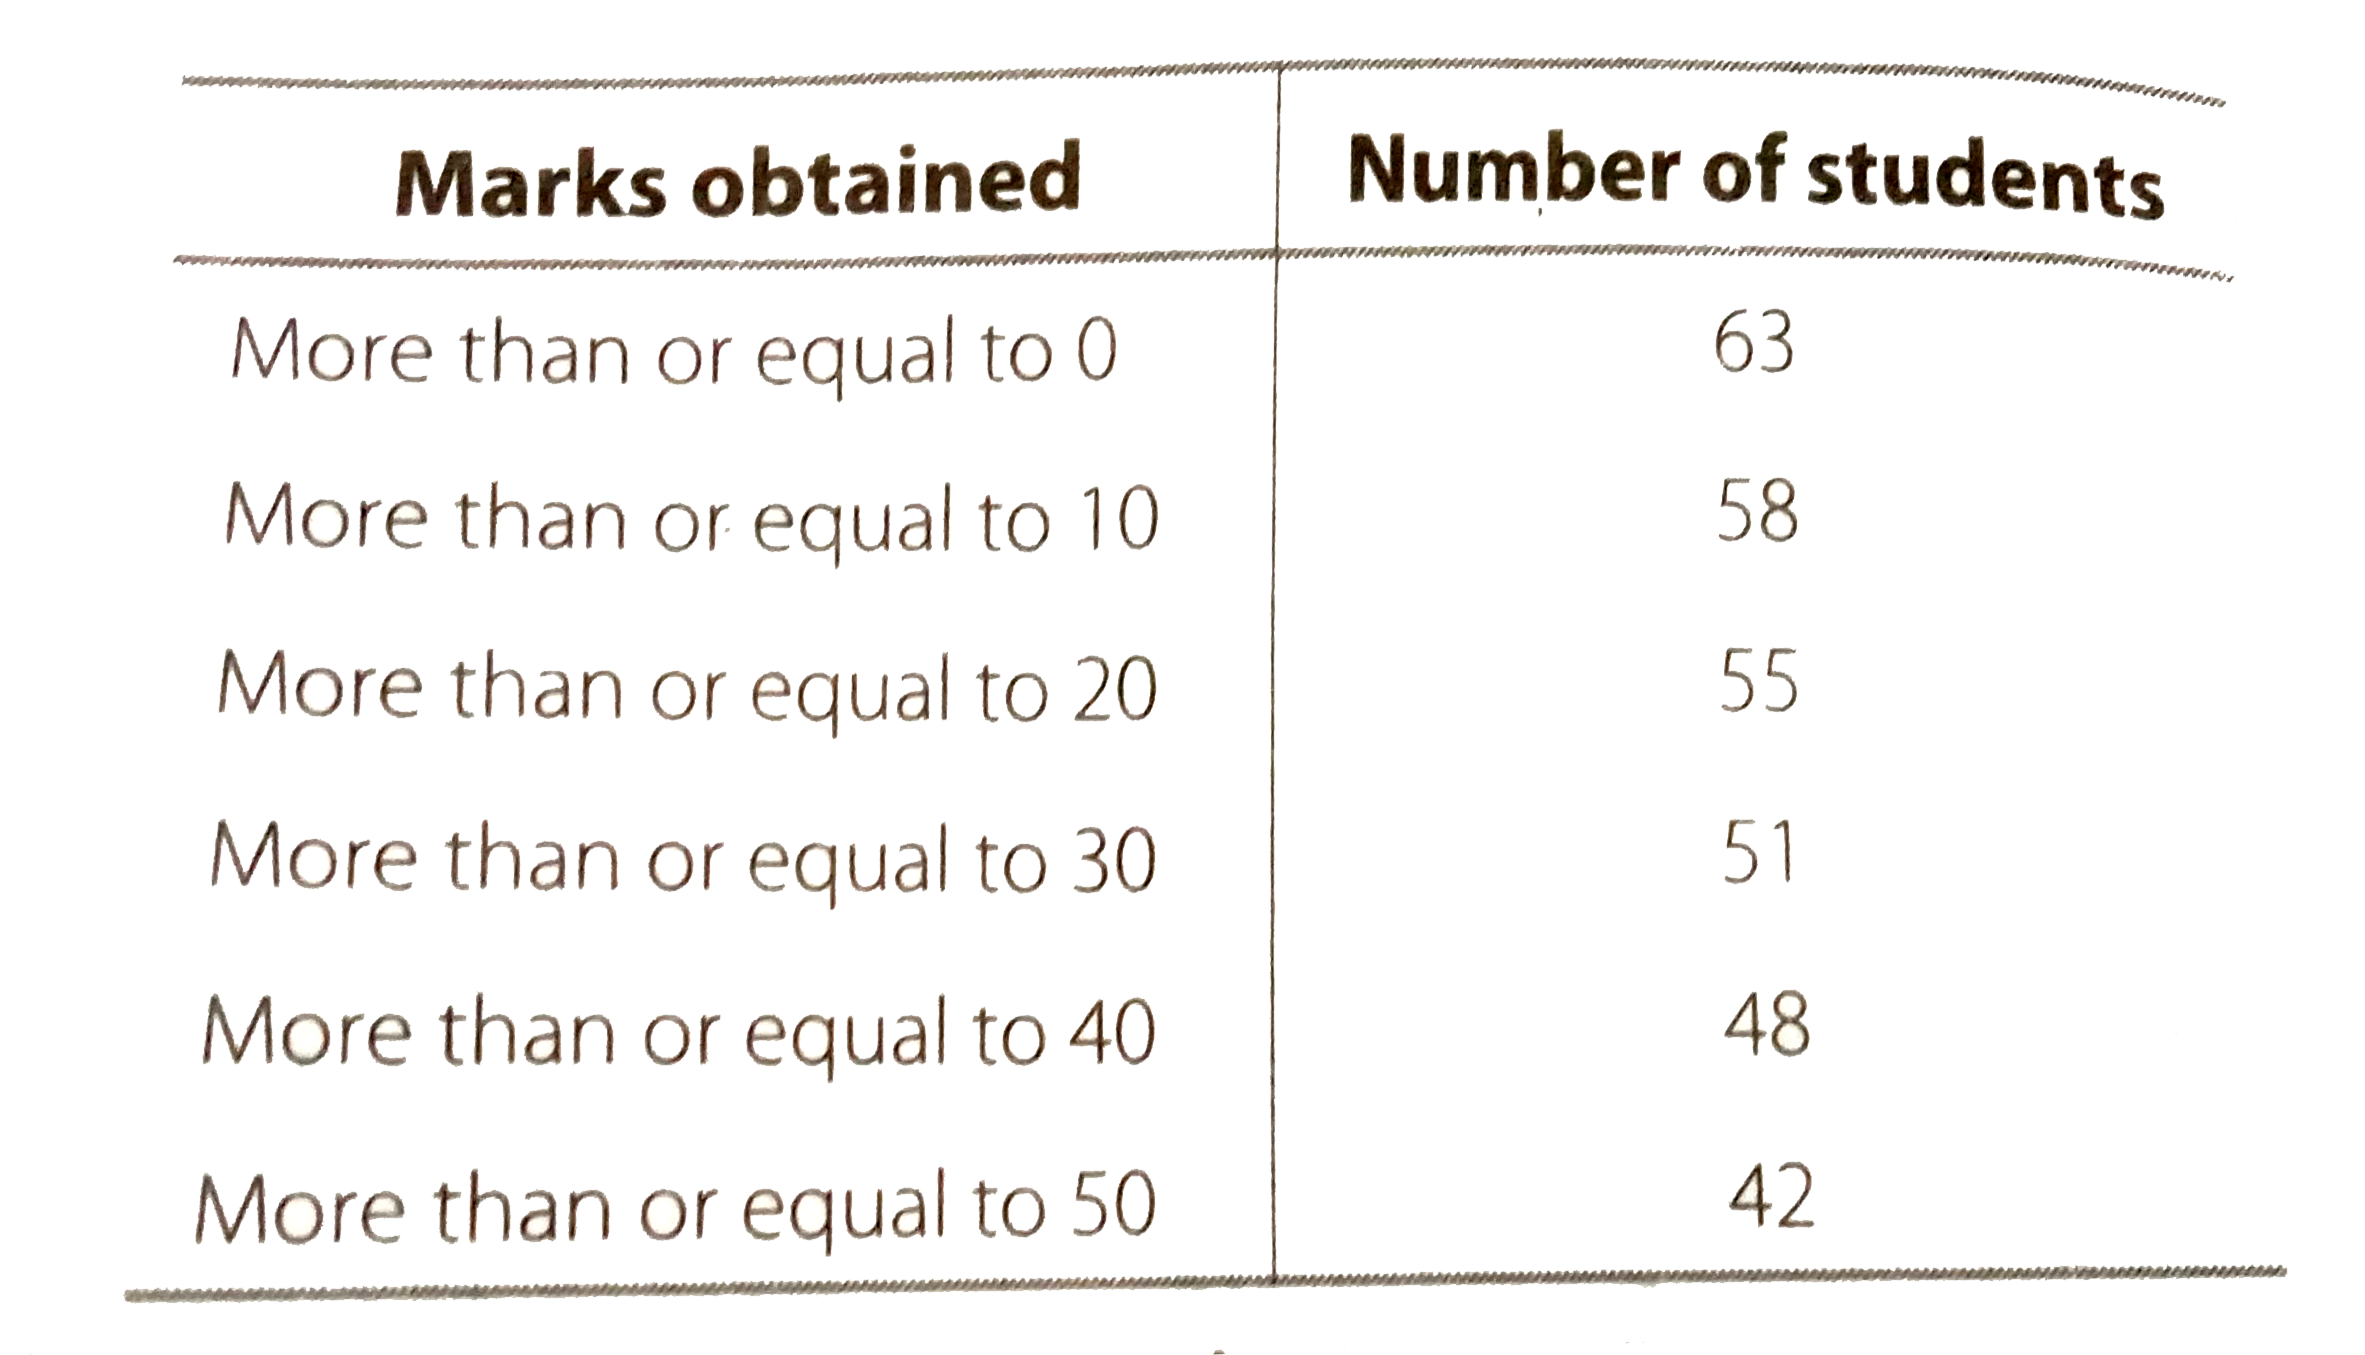
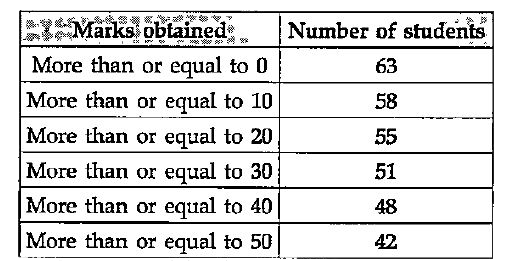
Consider the following distribution

Frequency of the class 30-40 isA3B4C48D51
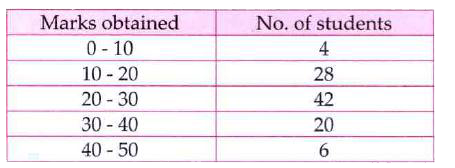
The marks of students of a class are given in following frequency distribution. Find the mean.
 View Solution
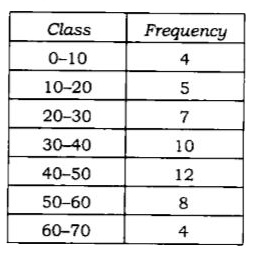
Determine the upper limit of the modal class of the following frequency distribution:
 View Solution
Consider the following frequency distribution
What is the median class?
 View Solution
Consider the following frequency distribution:

the upper limit of the median class isView SolutionConsider the following frequency distribution

The upper limit of the median class inView Solution


