Study the pie chart given below and answer the question that follow
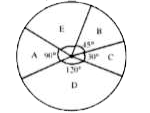
Which heads is allocated maximum funds?
A. Agriculture
B. Industry
C. Employment
D. Miscellaneous
The correct Answer is:C
Step by step video & image solution for Study the pie chart given below and answer the question that follow Which heads is allocated maximum funds? by Maths experts to help you in doubts & scoring excellent marks in Class 14 exams.
Updated on:21/07/2023Topper's Solved these Questions
Similar Questions
Study the pie chart given below and answer the question that follows. The total amount collected for flood relief from different sources is shown in the pie chart-

What is the approximate ratio of collection from corporates to Central Government ?
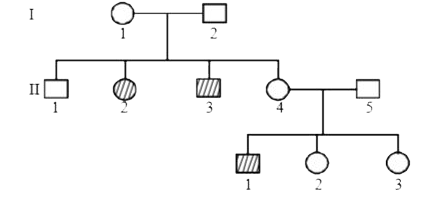
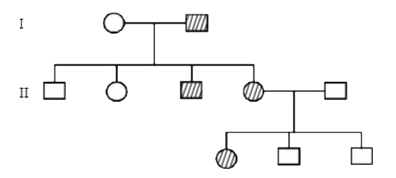
View SolutionStudy the given pedigree chart and answer the given questions :-
View Solution
Knowledge Check
Study the bar chart given below and answer the following questions :
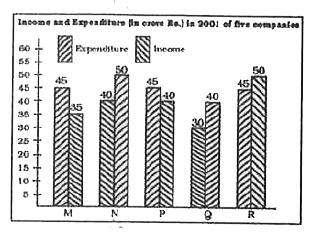
The company earning the maximum percentage of profit in the year 2001 is :AQBMCNDPThe following pie chart shows proportion of population of seven villages in 2009. Study the pie chart and answer the questions that follow :
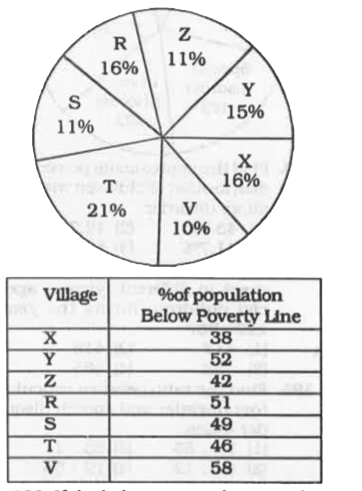
If the population of the village 'R' is 32000, then the below poverty line population of village 'Y' isA14100B15600C16500D17000The given pie chart shows the percentage distribution of 450 employees in an organisation. Study the pie chart and answer the question that follows
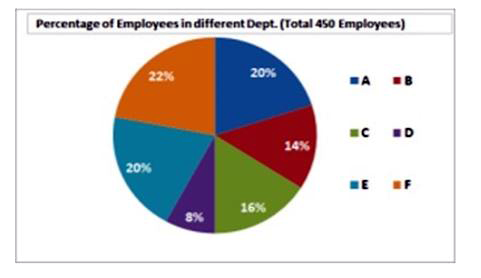
If 60% of the employees in department E are females, how many male employee are there in that department ?A18B54C72D36
Study the given pedigree chart and answer the given questions :-
View SolutionThe following pie chart shows proportion of population of seven villages in 2009. Study the pie chart and answer the questions that follow :
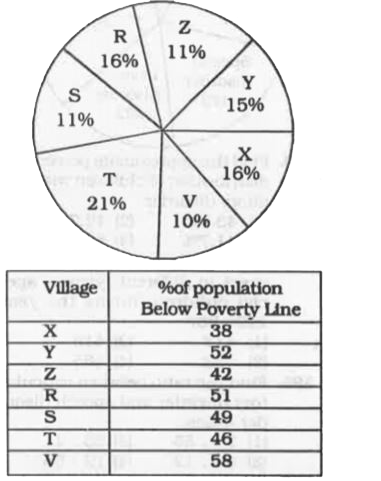
If ratio of the below poverty line population of the village 'T' to that of the below poverty line population of village 'Z' is
View SolutionThe given pie chart shows the percentage distribution of 450 employees in an organisation. Study the pie chart and answer the question that follows
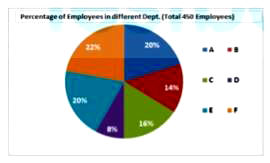
What is the central angle of the sector representing the number of employees in department A ?
View SolutionThe given pie chart shows the percentage distribution of 450 employees in an organisation. Study the pie chart and answer the question that follows.
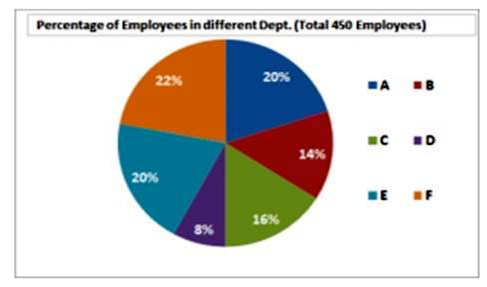
What is the number of employees working in departmetn B?
View SolutionThe following pie chart shows proportion of population of seven villages in 2009. Study the pie chart and answer the questions that follow :
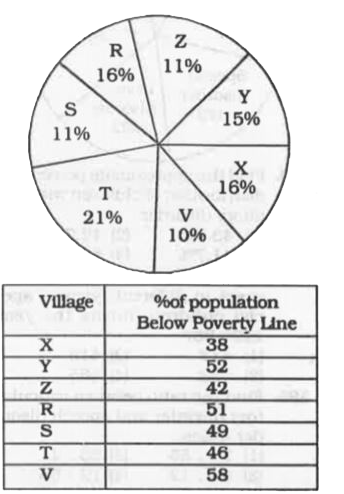
If the below poverty line population of the village 'X' is 12160, then the population of village 'S' is
View Solution
