In the last financial year, a car company sold 41,800 cars. In this year, the target is to sell 51,300 cars. By what per cent must the sale be increased?
11 922 %
8 922 %
8 1123 %
22 811 %
The correct Answer is:D
To find the percentage increase in car sales from last year to this year, we can follow these steps:
Step 1: Identify the values
- Last year's sales = 41,800 cars
- This year's target sales = 51,300 cars
Step 2: Calculate the increase in sales
To find the increase in sales, we subtract last year's sales from this year's target sales:
Increase in sales=This year's sales−Last year's sales=51,300−41,800
Increase in sales=9,500 cars
Step 3: Calculate the percentage increase
To find the percentage increase, we use the formula:
Percentage Increase=(Increase in salesLast year's sales)×100
Substituting the values we have:
Percentage Increase=(9,50041,800)×100
Step 4: Perform the division
Now we calculate the division:
9,50041,800≈0.227
Step 5: Multiply by 100 to get the percentage
Now, we multiply by 100 to convert it into a percentage:
Percentage Increase≈0.227×100≈22.7%
Step 6: Final answer
Thus, the percentage by which the sales must be increased is approximately 22.7%.
---
- Last year's sales = 41,800 cars
- This year's target sales = 51,300 cars
To find the increase in sales, we subtract last year's sales from this year's target sales:
Increase in sales=This year's sales−Last year's sales=51,300−41,800
Increase in sales=9,500 cars
To find the percentage increase, we use the formula:
Percentage Increase=(Increase in salesLast year's sales)×100
Substituting the values we have:
Percentage Increase=(9,50041,800)×100
Now we calculate the division:
9,50041,800≈0.227
Now, we multiply by 100 to convert it into a percentage:
Percentage Increase≈0.227×100≈22.7%
Thus, the percentage by which the sales must be increased is approximately 22.7%.
Topper's Solved these Questions
- BOOK - KIRAN PUBLICATIONCHAPTER - PERCENTAGE EXERCISE - TEST YOURSELF23videos
PERCENTAGE
- BOOK - KIRAN PUBLICATIONCHAPTER - PERCENTAGE EXERCISE - TYPE-X35videos
PERCENTAGE
- BOOK - KIRAN PUBLICATIONCHAPTER - NUMBER SYSTEMEXERCISE - TEST YOURSELF25videos
NUMBER SYSTEM
- BOOK - KIRAN PUBLICATIONCHAPTER - PIPE AND CISTERN EXERCISE - TIPE-IV9videos
PIPE AND CISTERN
Similar Questions
Knowledge Check
- Question 1 - Select One
The table shows the production of different types of cars by a company (in thousands) in 5 years.

The average production of type D cars in 5 years is what percent less than the production of type E cars in 2018? (Correct to one decimal place)Aa) 16.8Bb) 15.9Cc) 17.4Dd) 18.6 - Question 2 - Select One
The table shows the production of different types of cars by a company (in thousands) in 5 years.

The total production of type B cars in all the five years is what percent more than the total production of type A. B and D cars in 2017?Aa) 47.5Bb) 32.2Cc) 57.3Dd) 49.5 - Question 3 - Select One
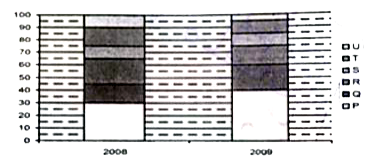
Read the following graph carefully and answer the questions given below.
Percentage of cars of 6 different models produced by a company in two years.

In 2009 the number of P model cars is what percent that of U model cars ?A400B800C600D200
The average sale of a car dealership was 15 cars per week. After a promotional scheme the average sale increased to 21 cars per week. The percentage increase in the sale of cars was (a) 39.33% (b) 40% (c) 4267% (d) 140%
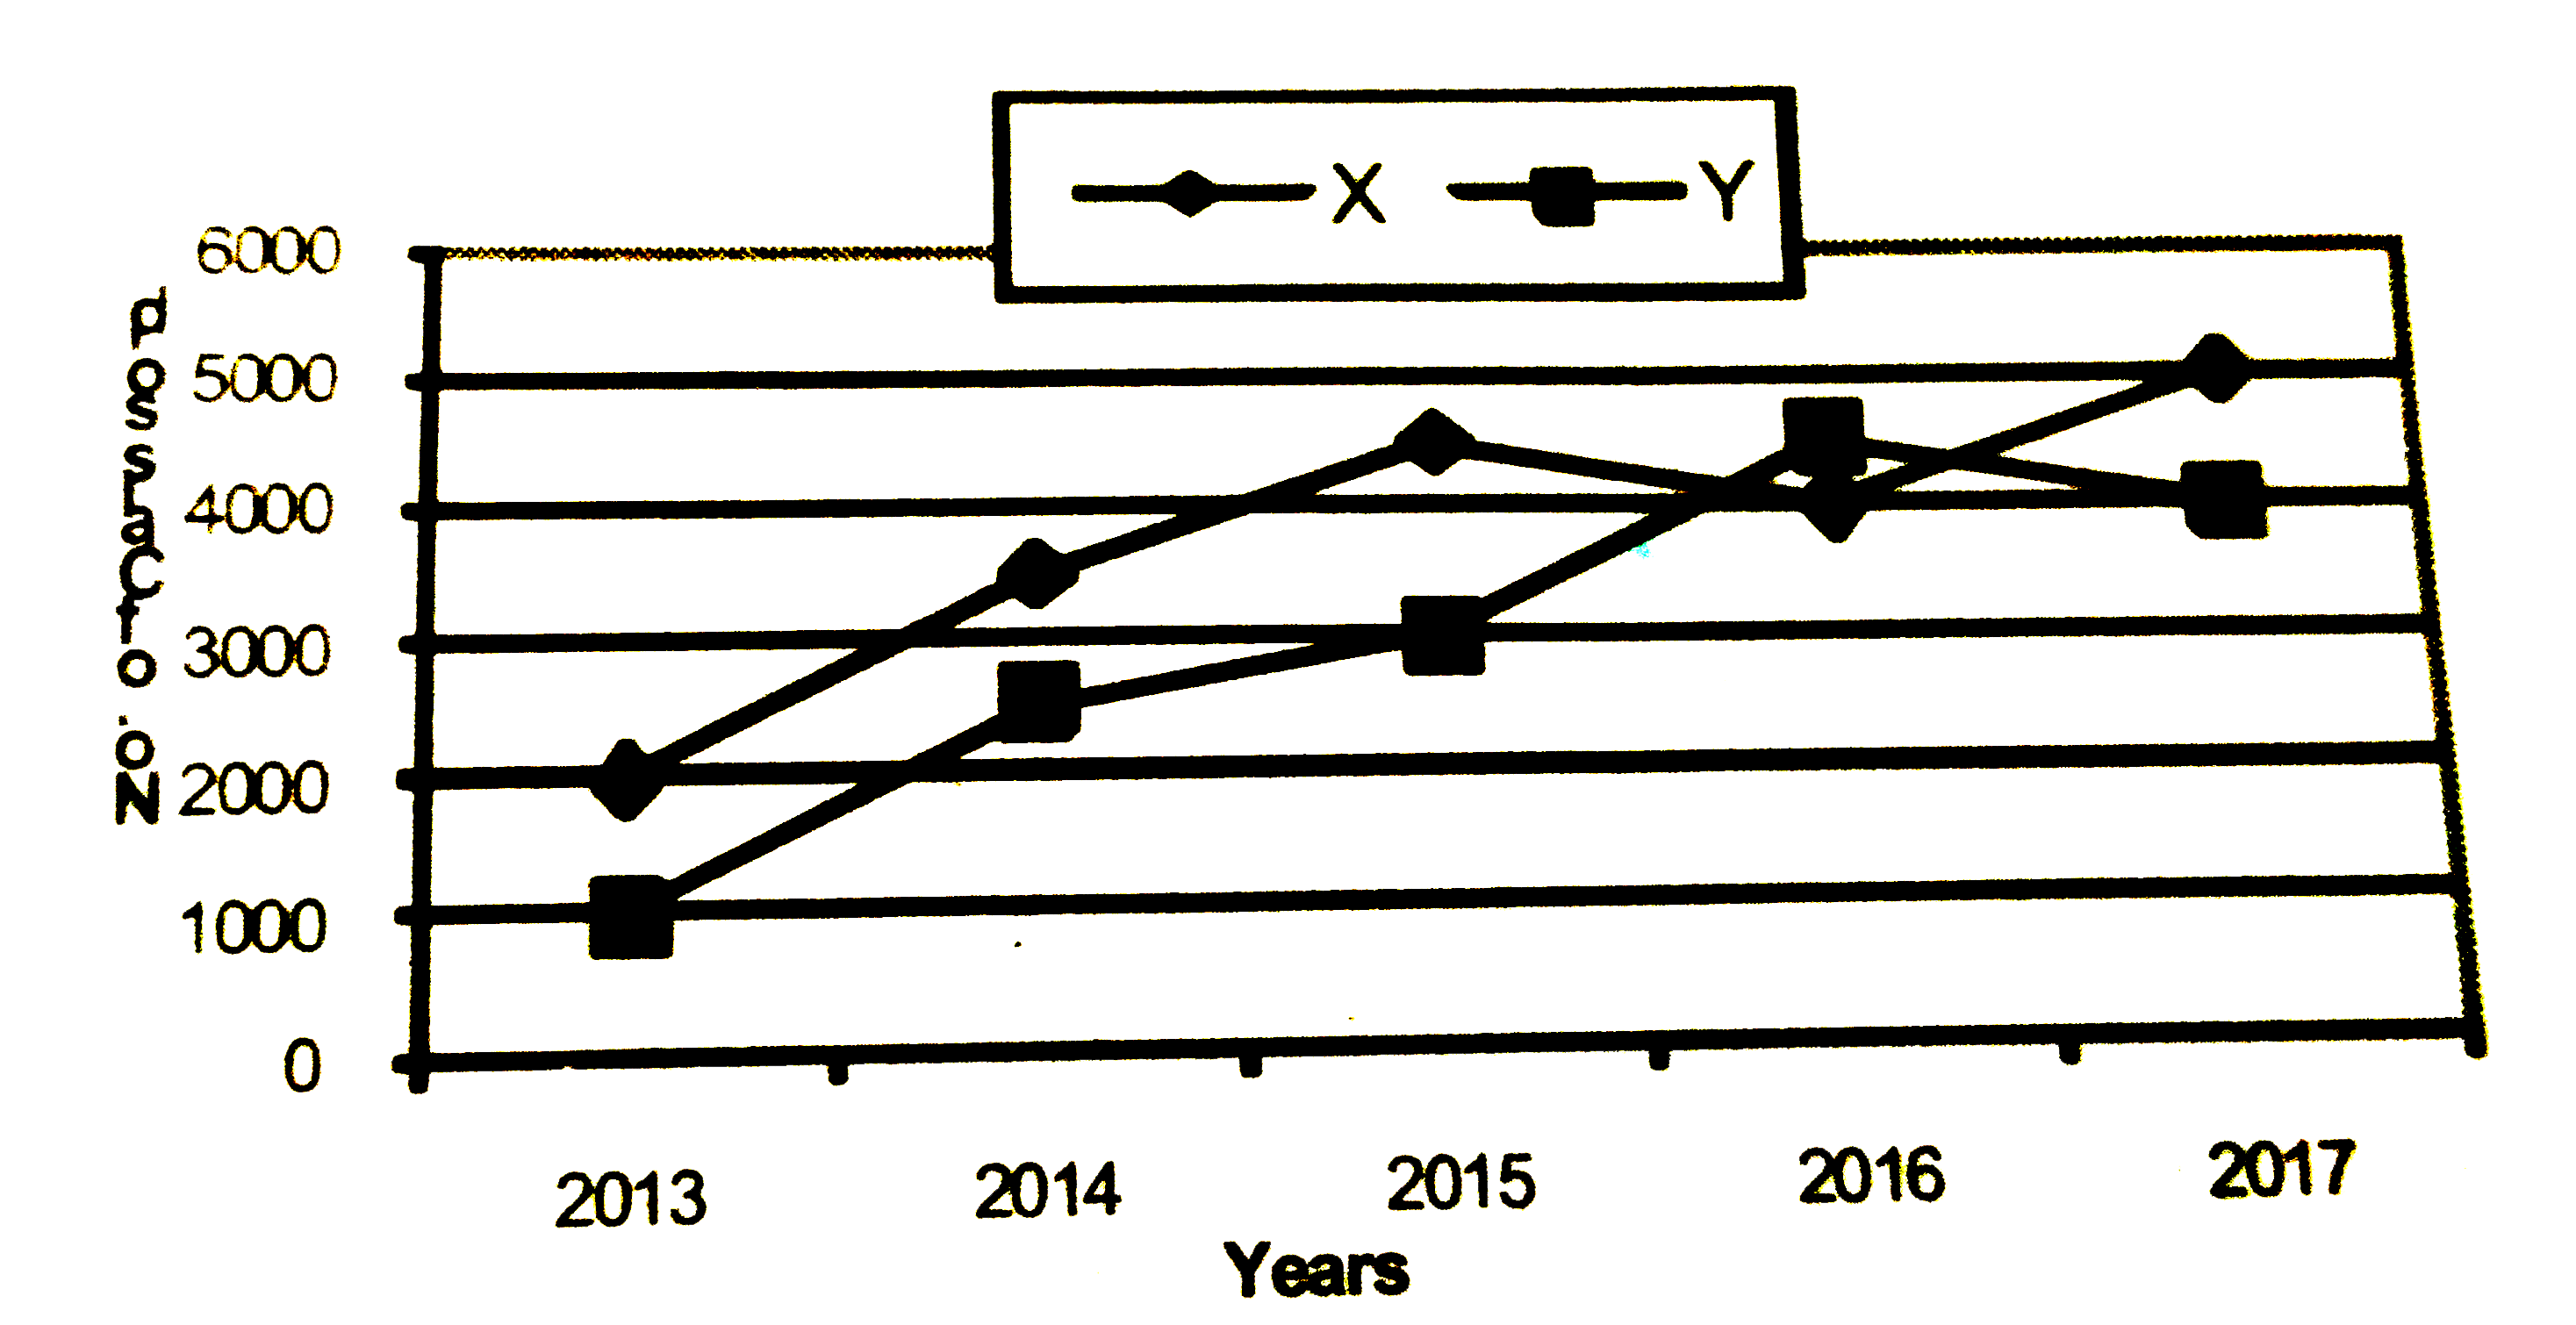
View SolutionThere are two car manufacturing companies (Company X and Company Y). The sale of cars by these two different companies is given in different years.

Total cars sold by both companies in year 2014 are what percent more/less the total cars sold by both companies in year 2015 ?View SolutionRaju sold his car for Rs. 126000 at a gain of 5%. In order to gain 10%, at what price should he sell the car?
View Solution
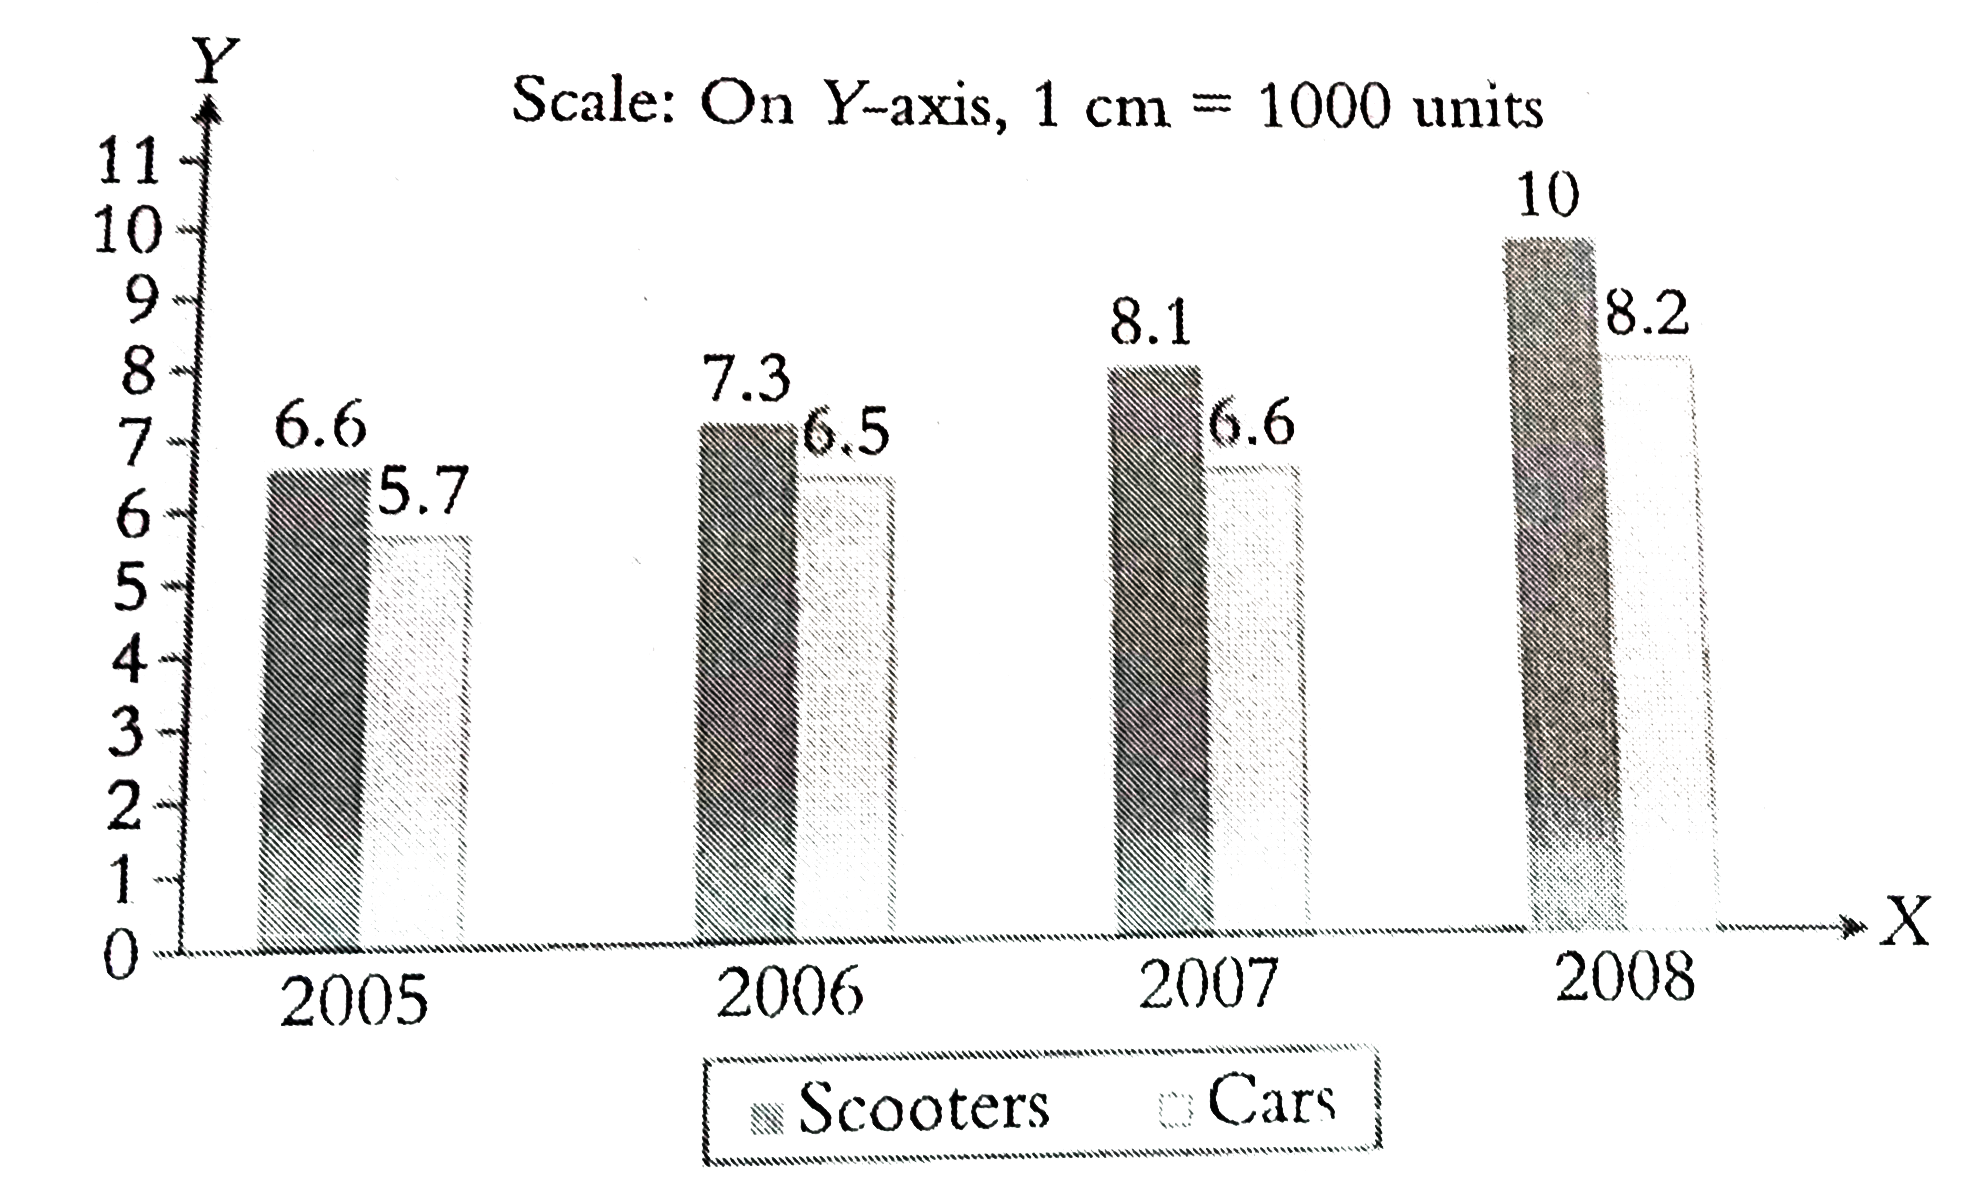
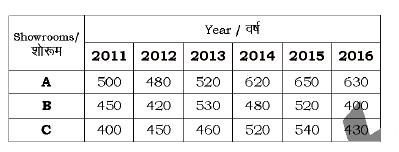
In which year is the difference between the sales of the scooters and the sales of cars the least ?View SolutionThe table shows the number of cars sold by three showrooms over a period of six year.

The total number of cars sold by all three showrooms over the years is represented as a pie chart, what is the central angle of the sector representing the total number of cars sold in the year 2013View Solution

