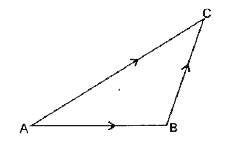
In triangle ABC, which of the following is not true :
 Solution in Punjabi
−−→AB+−−→BC+−−→CA=→0
−−→AB+−−→BC−−−→AC=→0
−−→AB+−−→BC−−−→CA=→0
−−→AB−−−→CB+−−→CA=→0
The correct Answer is:C
Step by step video, text & image solution for In triangle ABC, which of the following is not true : by Maths experts to help you in doubts & scoring excellent marks in Class 12 exams.
Updated on:21/07/2023Topper's Solved these Questions
- SAMPLE QUESTION PAPER-VII BOOK - ACCURATE PUBLICATIONCHAPTER - SAMPLE QUESTION PAPER-VII EXERCISE - SECTION-A (FILL IN THE BLANKS)
8 Videos
- SAMPLE QUESTION PAPER-VII BOOK - ACCURATE PUBLICATIONCHAPTER - SAMPLE QUESTION PAPER-VII EXERCISE - SECTION-A (TRUE OR FALSE)
8 Videos
- SAMPLE QUESTION PAPER-VI BOOK - ACCURATE PUBLICATIONCHAPTER - SAMPLE QUESTION PAPER-VI EXERCISE - SECTION C
15 Videos
- SAMPLE QUESTION PAPER-VIII BOOK - ACCURATE PUBLICATIONCHAPTER - SAMPLE QUESTION PAPER-VIII EXERCISE - SECTION-D
6 Videos
Similar Questions
Fill in the blanks from the given options: t2,2,−2,0,29,xsinx,111tan11x+19tan9x+C,1,2,4
Let A = {1, 2, 3}. Then number of equivalence relations containing (1,2) is ..............
View Solution2tan−1x=sin−12x1+x2,|x|≤1.
View SolutionSimplify: tan−1(√1+x2−1x)
View SolutionUse product ⎡⎢⎣1−1202−33−24⎤⎥⎦⎡⎢⎣−20192−361−2⎤⎥⎦ to solve the system of equationsx−y+2z=1,2y−3z=1,3x−2y+4z=2
View SolutionMatch the following lists:

View SolutionHow many lines of symmetry does the above figure have ?
View SolutionWhich of the following are correct chain isomers of butane ? (i)
View SolutionDetermine the point of symmetry of a regular hexagon.
View SolutionDtermine the images of the following figure about the given line :
View SolutionMatch the following Column A to Column B

View SolutionMatch the following Column A to Column B

View SolutionMatch the following Column A to Column B

View SolutionThe inequation represented by the graph given below is :
View SolutionThe inequation that best describes the graph given below is _________
View SolutionThe inequation that best describes the following graph is _________
View SolutionWhich inequations represent the shaded region in the given figure
View Solution
