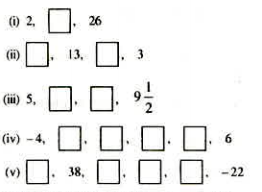
In the following APs, find the missing terms in the boxes :
 Solution in Punjabi
The correct Answer is:14
Step by step video, text & image solution for In the following APs, find the missing terms in the boxes : by Maths experts to help you in doubts & scoring excellent marks in Class 10 exams.
Updated on:21/07/2023Topper's Solved these Questions
- ARITHMETIC PROGRESSIONSBOOK - SWAN PUBLICATIONCHAPTER - ARITHMETIC PROGRESSIONSEXERCISE - Exercise 5.3
35 Videos
- ARITHMETIC PROGRESSIONSBOOK - SWAN PUBLICATIONCHAPTER - ARITHMETIC PROGRESSIONSEXERCISE - Exercise 5.4
5 Videos
- ARITHMETIC PROGRESSIONSBOOK - SWAN PUBLICATIONCHAPTER - ARITHMETIC PROGRESSIONSEXERCISE - Exercise 5.4
5 Videos
- AREAS RELATED TO CIRCLES BOOK - SWAN PUBLICATIONCHAPTER - AREAS RELATED TO CIRCLES EXERCISE - EXERCISE 12.3
14 Videos
- CIRCLESBOOK - SWAN PUBLICATIONCHAPTER - CIRCLESEXERCISE - Exercise 10.2
13 Videos
Similar Questions
Find the sum of the following APs :- 2, 7, 12, ... to 10 terms.
View SolutionWhich term of the A.P. 121, 117, 113, ... is its first negative term ?
View SolutionWhich term of the A.P. 121, 117, 113, ... is its first negative term ?
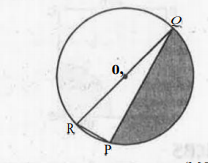
View SolutionFind the area of the shaded region in Fig., if PQ = 24 cm, PR = 7 cm and O is the centre of the circle.

View SolutionFrom a point Q, the length of the tangent to a circle is 24 cm and the distance of Q from the centre is 25 cm. The radius of the circle is
View SolutionWhich of the following are correct chain isomers of butane ? (i)
View SolutionDetermine the point of symmetry of a regular hexagon.
View SolutionDtermine the images of the following figure about the given line :
View SolutionMatch the following Column A to Column B

View SolutionMatch the following Column A to Column B

View SolutionMatch the following Column A to Column B

View SolutionFind the area of figure given below.

View SolutionFind the area of the figure given below.

View SolutionThe inequation represented by the graph given below is :
View SolutionThe inequation that best describes the graph given below is _________
View SolutionThe inequation that best describes the following graph is _________
View Solution
