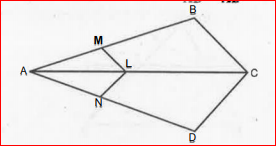
In fig., LM || CB , and LN||CD.Prove that AMAB=ANAD .
 .Solution in Punjabi
Step by step video & image solution for In fig., LM || CB , and LN||CD.Prove that (AM)/(AB)=(AN)/(AD) . . by Maths experts to help you in doubts & scoring excellent marks in Class 10 exams.
Updated on:21/07/2023Topper's Solved these Questions
- TRIANGLESBOOK - SWAN PUBLICATIONCHAPTER - TRIANGLESEXERCISE - EXERCISE 6.3
15 Videos
- TRIANGLESBOOK - SWAN PUBLICATIONCHAPTER - TRIANGLESEXERCISE - EXERCISE 6.4
9 Videos
- TRIANGLESBOOK - SWAN PUBLICATIONCHAPTER - TRIANGLESEXERCISE - EXERCISE 6.6 (OPTIONAL)
8 Videos
- SURFACE AREAS AND VOLUMES BOOK - SWAN PUBLICATIONCHAPTER - SURFACE AREAS AND VOLUMES EXERCISE - EXERCISE 13.5(Optional)
7 Videos
Similar Questions
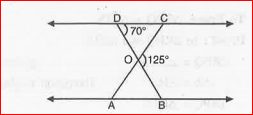
In fig., △ODC−△OBA, ∠BOC=125∘0 and ∠CDO=70∘0. Find ∠DOC, ∠DCO and ∠OAB .

View SolutionLet ΔABC~ΔDEF and their areas be, respectively, 64 cm2 and 121 cm2. If EF = 15.4 cm, find BC.
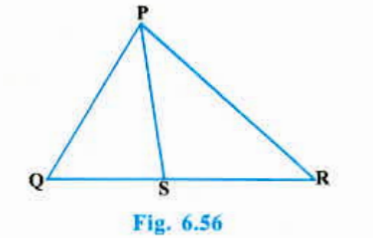
View SolutionIn Fig. 6.56, PS is the bisector of ∠QPR of ΔPQR. Prove that QSSR=PQPR

View SolutionA copper wire 3 mm in diameter is wound about a cylinder whose length is 12 cm, and diameter 10 cm,so as to cover the curved surface of the cylinder. Find the length and mass of the wire, assuming the density of copper to 8.88 g per cm3.
View SolutionHow many lines of symmetry does the above figure have ?
View SolutionWhich of the following are correct chain isomers of butane ? (i)
View SolutionDetermine the point of symmetry of a regular hexagon.
View SolutionDtermine the images of the following figure about the given line :
View SolutionIn the figure above (not to scale), ¯¯¯¯¯¯AB⊥¯¯¯¯¯¯CDandAD is the bisector of ∠BAE.AB=3cm and AC=5cm. Find CD.
View SolutionMatch the following Column A to Column B

View SolutionMatch the following Column A to Column B

View SolutionMatch the following Column A to Column B

View SolutionFind the area of the figure given below.

View SolutionThe area of the shaded part in the figure given below is ______.

View SolutionThe inequation represented by the graph given below is :
View SolutionThe inequation that best describes the graph given below is _________
View Solution
