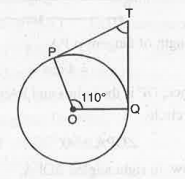
In Fig., if TP and TQ and two tangents to a circle with centre O so that ZPOQ = 110∘, then ZPTQ is equal to
 Solution in Punjabi
60∘
70∘
80∘
90∘
The correct Answer is:B
Step by step video & image solution for In Fig., if TP and TQ and two tangents to a circle with centre O so that ZPOQ = 110^@, then ZPTQ is equal to by Maths experts to help you in doubts & scoring excellent marks in Class 10 exams.
Updated on:21/07/2023Topper's Solved these Questions
- CIRCLESBOOK - SWAN PUBLICATIONCHAPTER - CIRCLESEXERCISE - Exercise 10.1 (Fill in the blanks)
4 Videos
- ARITHMETIC PROGRESSIONSBOOK - SWAN PUBLICATIONCHAPTER - ARITHMETIC PROGRESSIONSEXERCISE - Exercise 5.4
5 Videos
- CONSTRUCTIONS BOOK - SWAN PUBLICATIONCHAPTER - CONSTRUCTIONS EXERCISE - EXERCISE 11.2
6 Videos
Similar Questions
Fill in the blanks : A tangent to a circle intersects it in ............... point(s).
View SolutionWhich term of the A.P. 121, 117, 113, ... is its first negative term ?
View SolutionDraw a circle of radius 6cm. From a point 10 cm away from its centre, construct the pair of tangents to the circle and measure their lengths.
View SolutionIn the given figure (not to scale), O is the centre of the circle. A,B,C and D are concyclic and AB=CD . If /_MON =120^(@) , then find /_ OPN .
View SolutionHow many lines of symmetry does the above figure have ?
View SolutionWhich of the following are correct chain isomers of butane ? (i)
View SolutionDetermine the point of symmetry of a regular hexagon.
View SolutionDtermine the images of the following figure about the given line :
View SolutionIn the given figure, AB is a diameter, O is the center of the circle and ∠OCB=50∘ then find ∠DBC.
View SolutionMatch the following Column A to Column B

View SolutionMatch the following Column A to Column B

View SolutionMatch the following Column A to Column B

View SolutionThe inequation represented by the graph given below is :
View SolutionThe inequation that best describes the graph given below is _________
View SolutionThe inequation that best describes the following graph is _________
View SolutionWhich inequations represent the shaded region in the given figure
View Solution
