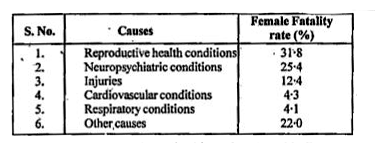
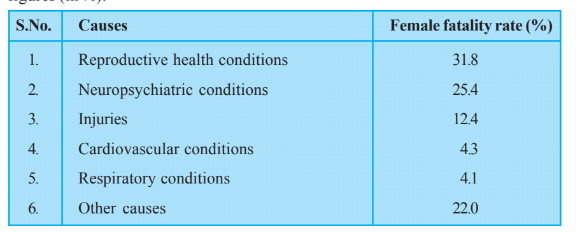
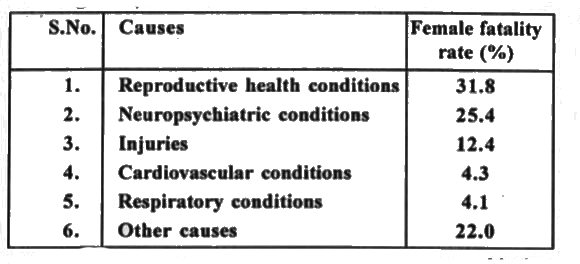
A survey conducted by an organisation for the cause of illness and death among the women between the ages 15-44 (in years) worldwide, found the following figures (in %):

Represent the information given above graphically. Solution in Punjabi
Step by step video & image solution for A survey conducted by an organisation for the cause of illness and death among the women between the ages 15-44 (in years) worldwide, found the following figures (in %): Represent the information given above graphically. by Maths experts to help you in doubts & scoring excellent marks in Class 9 exams.
Updated on:21/07/2023Topper's Solved these Questions
- STATISTICS BOOK - SWAN PUBLICATIONCHAPTER - STATISTICS EXERCISE - EXERCISE 14.4
7 Videos
- STATISTICS BOOK - SWAN PUBLICATIONCHAPTER - STATISTICS EXERCISE - Objective Type Questions
16 Videos
- STATISTICS BOOK - SWAN PUBLICATIONCHAPTER - STATISTICS EXERCISE - EXERCISE 14.2
15 Videos
- QUADRILATERALSBOOK - SWAN PUBLICATIONCHAPTER - QUADRILATERALSEXERCISE - Objective Type Questions ( Fill in the Blanks)
10 Videos
- SURFACE AREAS AND VOLUMES BOOK - SWAN PUBLICATIONCHAPTER - SURFACE AREAS AND VOLUMES EXERCISE - Objective Type Questions (Fill in the Blanks )
7 Videos
Similar Questions
The following number of goals were scored by a team in a series of 10 matches : 2, 3, 4, 5, 0, 1, 3, 3, 4, 3 Find mean, median and mode of these scores :
View SolutionWhat is raw data or ungrouped data ?
View SolutionThe blood groups of 30 students of Class VIII are recorded as follows: A, B, O, O, AB, O, A, O, B, A, O, B, A, O, O, A, AB, O, A, A, O, O, AB, B, A, O, B, A, B, O. Represent this data in the form of a frequency distribution table. Which is the most common, and which is the rarest, blood group among these students?
View SolutionSum of the angles of a quadrilateral is ................ .
View SolutionTotal surface area of a cone = ..............
View SolutionA survey conducted by an organization for the cause of illness and death among the women between the ages 15 - 44 (in years) worldwide, found the following figures (in %):

View SolutionDetermine the point of symmetry of a regular hexagon.
View SolutionMatch the following Column A to Column B

View SolutionMatch the following Column A to Column B

View SolutionMatch the following Column A to Column B

View SolutionThe inequation represented by the graph given below is :
View SolutionThe inequation that best describes the graph given below is _________
View SolutionThe inequation that best describes the following graph is _________
View SolutionWhich inequations represent the shaded region in the given figure
View SolutionA survey conducted by an organisation for the cause of illness nad death among the women between the ages 15-44 (in years) worldwide, found the following figures (in %) :

(ii) Which condition is the major cause of women's ill health and death worldwide ?
View SolutionA survey conducted by an organisation for the cause of illness and death among the women between the ages 15 - 44 (in years) worldwide, found the following figures (in %):
View Solution
