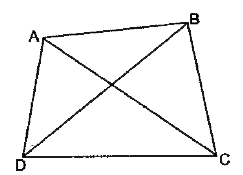
For the given quadrilateral ABCD, name :

Angles adjacent to BSolution in Punjabi
The correct Answer is:∠A,∠C
Step by step video, text & image solution for For the given quadrilateral ABCD, name : Angles adjacent to B by Maths experts to help you in doubts & scoring excellent marks in Class 6 exams.
Updated on:21/07/2023Topper's Solved these Questions
- BASIC GEOMETRICAL CONCEPTSBOOK - SWAN PUBLICATIONCHAPTER - BASIC GEOMETRICAL CONCEPTSEXERCISE - EXERCISE 8.6
28 Videos
- BASIC GEOMETRICAL CONCEPTSBOOK - SWAN PUBLICATIONCHAPTER - BASIC GEOMETRICAL CONCEPTSEXERCISE - MULTIPLE CHOICE QUESTIONS
12 Videos
- BASIC GEOMETRICAL CONCEPTSBOOK - SWAN PUBLICATIONCHAPTER - BASIC GEOMETRICAL CONCEPTSEXERCISE - EXERCISE 8.4
17 Videos
- ALGEBRABOOK - SWAN PUBLICATIONCHAPTER - ALGEBRAEXERCISE - MULTIPLE CHOICE QUESTIONS
10 Videos
- DATA HANDLING BOOK - SWAN PUBLICATIONCHAPTER - DATA HANDLING EXERCISE - MULTIPLE CHOICE QUESTIONS
9 Videos
Similar Questions
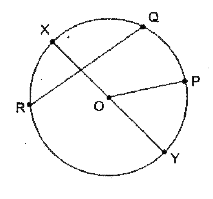
In the given figure, write the names of :-

Centre
View SolutionHow many lines can pass through a point ?
View SolutionWrite all the names of the following triangles in all order : -

View SolutionIf side of a square is denoted by x then its perimeter will be……
View SolutionIf * represents 10 flowers then how many flowers does * * * * * represent?
View SolutionDetermine the point of symmetry of a regular hexagon.
View SolutionDtermine the images of the following figure about the given line :
View SolutionMatch the following Column A to Column B

View SolutionMatch the following Column A to Column B

View SolutionMatch the following Column A to Column B

View SolutionFind the area of figure given below.

View SolutionFind the area of the figure given below.

View SolutionCalculate the volume of the given solid.
ltimg src="https://d10lpgp6xz60nq.cloudfront.net/physics_images/PS_MATH_VII_C06_E03_002_Q01.png" width="80%"gt
View SolutionThe area of the shaded part in the figure given below is ______.

View SolutionThe inequation represented by the graph given below is :
View SolutionThe inequation that best describes the graph given below is _________
View Solution
