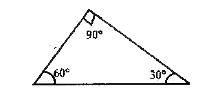
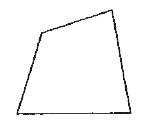
Classify each of the following triangles as acute, obtuse or right triangle :
 Solution in Punjabi
The correct Answer is:Right triangle
Step by step video, text & image solution for Classify each of the following triangles as acute, obtuse or right triangle : by Maths experts to help you in doubts & scoring excellent marks in Class 6 exams.
Updated on:21/07/2023Topper's Solved these Questions
- UNDERSTANDING ELEMENTARY SHAPESBOOK - SWAN PUBLICATIONCHAPTER - UNDERSTANDING ELEMENTARY SHAPESEXERCISE - Exercise 9.5
23 Videos
- UNDERSTANDING ELEMENTARY SHAPESBOOK - SWAN PUBLICATIONCHAPTER - UNDERSTANDING ELEMENTARY SHAPESEXERCISE - Exercise 9.6
21 Videos
- UNDERSTANDING ELEMENTARY SHAPESBOOK - SWAN PUBLICATIONCHAPTER - UNDERSTANDING ELEMENTARY SHAPESEXERCISE - Exercise 9.3
12 Videos
- SYMMETRYBOOK - SWAN PUBLICATIONCHAPTER - SYMMETRYEXERCISE - MULTIPLE CHOICE QUESTIONS
8 Videos
- WHOLE NUMBERSBOOK - SWAN PUBLICATIONCHAPTER - WHOLE NUMBERSEXERCISE - MULTIPLE CHOICE QUESTIONS
10 Videos
Similar Questions
Which of the followings are polygons and there is no polygon Give the reason :

View SolutionGive two examples of each of the following shapes from your surroundings:
Cube
View SolutionIdentify the shape having perpendicular lines :

View SolutionAn equilateral triangle has................lines of symmetry.
View SolutionThe smallest whole number is :
View SolutionHow many lines of symmetry does the above figure have ?
View SolutionWhich of the following are correct chain isomers of butane ? (i)
View SolutionDetermine the point of symmetry of a regular hexagon.
View SolutionDtermine the images of the following figure about the given line :
View SolutionMatch the following Column A to Column B

View SolutionMatch the following Column A to Column B

View SolutionMatch the following Column A to Column B

View SolutionThe inequation represented by the graph given below is :
View SolutionThe inequation that best describes the graph given below is _________
View SolutionThe inequation that best describes the following graph is _________
View SolutionWhich inequations represent the shaded region in the given figure
View Solution
