............ represents data through picture of objects.Solution in Punjabi
Bar Graph
Histogram
Pictograph
None, of these
The correct Answer is:C
Step by step video, text & image solution for ............ represents data through picture of objects. by Maths experts to help you in doubts & scoring excellent marks in Class 6 exams.
Updated on:21/07/2023Topper's Solved these Questions
- DATA HANDLING Book:SWAN PUBLICATIONChapter:DATA HANDLING Exercise:EXERCISE 14.3
Explore 5 Videos
- BASIC GEOMETRICAL CONCEPTSBook:SWAN PUBLICATIONChapter:BASIC GEOMETRICAL CONCEPTSExercise:MULTIPLE CHOICE QUESTIONS
Explore 12 Videos
- DECIMALSBook:SWAN PUBLICATIONChapter:DECIMALSExercise:MULTIPLE CHOICE QUESTIONS
Explore 20 Videos
Similar Questions
Read the adjoining bar graph showing the number of students in a particular class of a school:
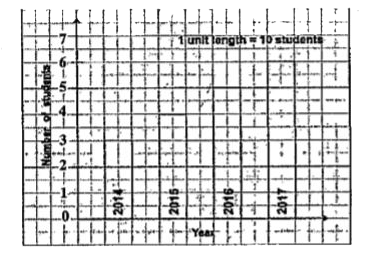
Answer tbe following questions :
(i) What is the scale of.this graph ?
(ii) How many students are there in 2016 ?
(iii) Is the number of students in the year 2017 twice the year 2014 ?
View SolutionHow many lines can pass through a point ?
View Solution3+210=.............
View SolutionIn a pictograph, a picture is represented by 375 units. If the data is represented by 30 pictures, then find the total numbers of units in the data.
View Solutionचित्र में प्रदर्शित लॉजिक निकाय निरूपित करता है

View SolutionA ______ is represented by pictures of objects.
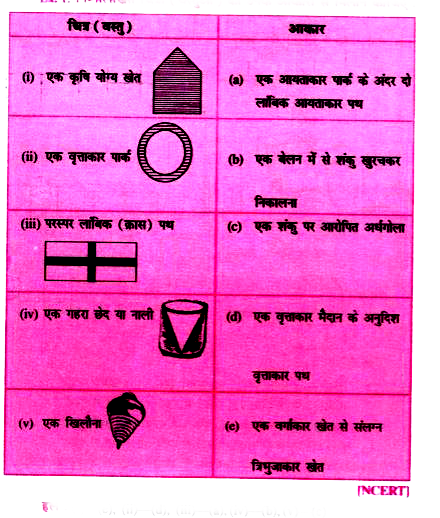
View Solutionनिम्नलिखित चित्रों (वस्तुओं) का उनके आकारों से मिलान कीजिए:
View Solutionनिम्नांकित आँकड़ों का आयत चित्र बनाइए।

View SolutionP ऑबिटल को चित्र द्वारा निरूपित कीजिये।
View SolutionRepresenting the data with the help of pictures is called ..........
View SolutionThe objective of diagrammatic representation of data is
View SolutionState whether the following statements are true or false:
A pictograph represents data in the form of pictures of objects or parts of objects.
View SolutionMatch the following pictures(objects) with their shapes:
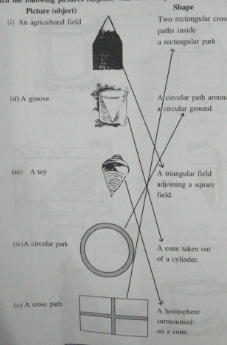 .
.
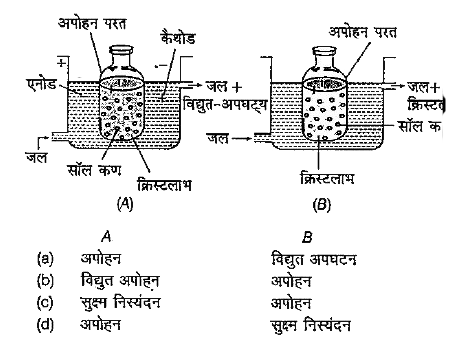
View Solutionचित्र (A) और (B) क्या प्रदर्शित करते हैं?
View Solution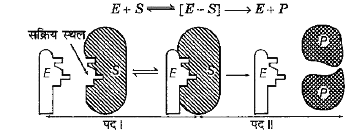
उपरोक्त चित्र क्या दर्शाता है?
View SolutionIn a pictograph, a picture is represented by 375 units. If the data is represented by 30 pictures, then find the total numbers of units in the data.
View Solution
