1. Each numerical figure in a data is called an ............... Solution in Punjabi
The correct Answer is:Observation
Step by step video, text & image solution for 1. Each numerical figure in a data is called an ............... by Maths experts to help you in doubts & scoring excellent marks in Class 7 exams.
Updated on:21/07/2023Topper's Solved these Questions
- DATA HANDLINGBOOK - SWAN PUBLICATIONCHAPTER - DATA HANDLINGEXERCISE - OTHER IMPORTANT QUESTIONS (TRUE OR FALSE)
8 Videos
- DATA HANDLINGBOOK - SWAN PUBLICATIONCHAPTER - DATA HANDLINGEXERCISE - OTHER IMPORTANT QUESTIONS (MULTIPLE CHOICE QUESTIONS)
13 Videos
- CONGRUENCE OF TRIANGLES BOOK - SWAN PUBLICATIONCHAPTER - CONGRUENCE OF TRIANGLES EXERCISE - OTHER IMPORTANT QUESTIONS (III: State whether following statements are true or false)
8 Videos
- EXPONENTS AND POWERS BOOK - SWAN PUBLICATIONCHAPTER - EXPONENTS AND POWERS EXERCISE - OTHER IMPORTANT QUESTIONS (TRUE FALSE)
8 Videos
Similar Questions
A table šlowing the frequency of various observations is called a frequency distribution table. ?
View SolutionIn a set of observations the observation that occurs most often is called :
View SolutionTwo angles are congruent if they have equal measure.
View SolutionWhich of the statement is true and which is false
If a any non zero rational number then a0=a.
View SolutionA data warehouse Contains numerous naming conventions and formats
View Solutionरिक्त स्थान को भरे
यदि ऑकड़ों की सत्यता का उत्तरदायित्व अन्वेषक पर हो तो ऑकड़ों को.......ऑकड़ों कहते है
View Solutionरिक्त स्थान को भरे
यदि ऑकड़े की सत्यता का उत्तरदायित्व अन्वेषक पर न हो तो ऑकड़ों को........ऑकड़ों कहते है
View SolutionArranging the numerical figures in an ascending or a descending order is called an……………
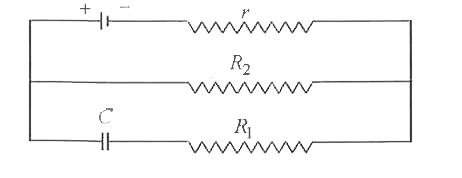
View Solutionसंलग्न चित्र में संधारित्र C की प्रत्येक प्लेट पर आवेश का आंकिक मान ज्ञात कीजिए।

View Solutionउस युक्ति का नाम बताएँ जो अन्कीय आंकड़ों को अनुरूप सिग्नलों द्वारा और अनुरूप सिग्नलों को अन्कीय आंकड़ों द्वारा निरूपित करता है।
View SolutionThe method of classification in which numerical data is used to evaluate similarities and differences is called -
View SolutionGraphics and bar graphs are graphical representations of numerical data.
View Solutionदिये हुए आंकड़ो को आरोही या अवरोही कम में व्यवस्थित किया जाये तो बिल्कुल मध्य में स्थित आंकड़े -------------- कहते है।
View SolutionInformation collected in the form of facts, numerical figures, tables etc.is called
View SolutionGive two examples of data in numerical figures.
View Solution
