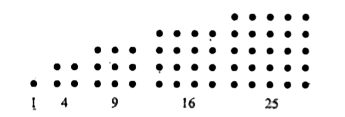
Observe the following pattern of squares made using dots.

If n is taken as the number of dots in each row then find the algebraic expression for number of dots in nth figure. Also find number of dots if.
n=7Solution in Punjabi
The correct Answer is:49
Step by step video, text & image solution for Observe the following pattern of squares made using dots. If n is taken as the number of dots in each row then find the algebraic expression for number of dots in nth figure. Also find number of dots if. n=7 by Maths experts to help you in doubts & scoring excellent marks in Class 7 exams.
Updated on:21/07/2023Topper's Solved these Questions
- ALGEBRAIC EXPRESSIONSBOOK - SWAN PUBLICATIONCHAPTER - ALGEBRAIC EXPRESSIONSEXERCISE - Exercise 12.3 (Multiple Choice Questions)
3 Videos
- ALGEBRAIC EXPRESSIONSBOOK - SWAN PUBLICATIONCHAPTER - ALGEBRAIC EXPRESSIONSEXERCISE - Other Important Questions (Multiple Choice Questions)
12 Videos
- ALGEBRAIC EXPRESSIONSBOOK - SWAN PUBLICATIONCHAPTER - ALGEBRAIC EXPRESSIONSEXERCISE - Exercise 12.2 (Multiple choice Questions)
3 Videos
- COMPARING QUANTITIES BOOK - SWAN PUBLICATIONCHAPTER - COMPARING QUANTITIES EXERCISE - OTHER IMPORTANT QUESTION (III. State whether the following statements are true or false:)
8 Videos
Similar Questions
If l is the length of the side of the regular pentagon, perimeter of a regular pentagon is
View SolutionWhat is one half of the sum of numbers x and y?
View SolutionThe algebraic expression for ''Number 5 added to three times the product of numbers m and n'' is
View SolutionTwo ratios can be compared by converting them into like fraction.
View SolutionHow many lines of symmetry does the above figure have ?
View SolutionDetermine the point of symmetry of a regular hexagon.
View SolutionDtermine the images of the following figure about the given line :
View SolutionMatch the following Column A to Column B

View SolutionMatch the following Column A to Column B

View SolutionMatch the following Column A to Column B

View SolutionFind the area of figure given below.

View SolutionFind the perimeter of the figure given below.

View SolutionFind the area of the figure given below.

View SolutionThe inequation represented by the graph given below is :
View SolutionThe inequation that best describes the graph given below is _________
View SolutionThe inequation that best describes the following graph is _________
View Solution
