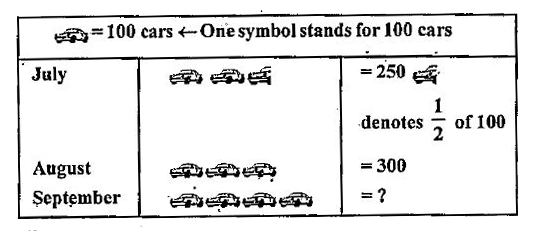
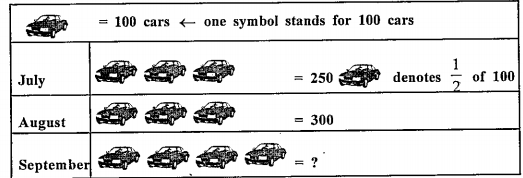
A pictograph : Pictorial representation of data using symbols.

In which month were produced were maximum number of cars produced ? Solution in Punjabi
The correct Answer is:September i.e., 400 cars
Step by step video, text & image solution for A pictograph : Pictorial representation of data using symbols. In which month were produced were maximum number of cars produced ? by Maths experts to help you in doubts & scoring excellent marks in Class 8 exams.
Updated on:21/07/2023Topper's Solved these Questions
- DATA HANDLINGBOOK - SWAN PUBLICATIONCHAPTER - DATA HANDLINGEXERCISE - Think, Discuss And Write
7 Videos
- DATA HANDLINGBOOK - SWAN PUBLICATIONCHAPTER - DATA HANDLINGEXERCISE - Try These
27 Videos
- CUBES AND CUBE ROOTS BOOK - SWAN PUBLICATIONCHAPTER - CUBES AND CUBE ROOTS EXERCISE - EXERCISE 7.2
9 Videos
- DIRECT AND INVERSE PROPORTIONS BOOK - SWAN PUBLICATIONCHAPTER - DIRECT AND INVERSE PROPORTIONS EXERCISE - Exercise 13.2
16 Videos
Similar Questions
If we change the position of any of the bars of a bar graph, would it change the information being conveyed ? Why ?
View SolutionDraw an appropriate graph to represent the given information.

View SolutionFind the cube root of each of the following numbers by prime factorisation method : 175616
View SolutionWhich of the following are in inverse proportion : The number of workers on a job and the time to complete the job.
View SolutionHow many lines of symmetry does the above figure have ?
View SolutionWhich of the following are correct chain isomers of butane ? (i)
View SolutionDetermine the point of symmetry of a regular hexagon.
View SolutionDtermine the images of the following figure about the given line :
View SolutionMatch the following Column A to Column B

View SolutionMatch the following Column A to Column B

View SolutionMatch the following Column A to Column B

View SolutionThe inequation represented by the graph given below is :
View SolutionThe inequation that best describes the graph given below is _________
View SolutionThe inequation that best describes the following graph is _________
View SolutionWhich inequations represent the shaded region in the given figure
View SolutionA Pictograph : Pictorial representation of data using symbols.

How many cars were produced in the month of July?
View Solution
