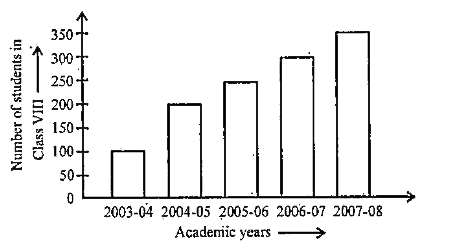
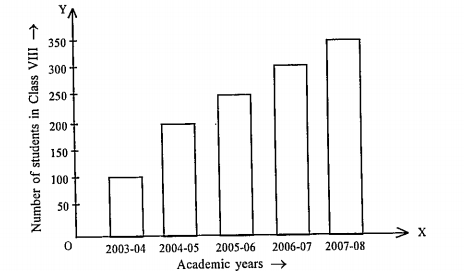
A bar graph : A display of information using bars of uniform width, their heights being proportional to the respective values.
In which year is the number of students maximum ?
 Solution in Punjabi
Step by step video & image solution for A bar graph : A display of information using bars of uniform width, their heights being proportional to the respective values. In which year is the number of students maximum ? by Maths experts to help you in doubts & scoring excellent marks in Class 8 exams.
Updated on:21/07/2023Topper's Solved these Questions
- DATA HANDLINGBOOK - SWAN PUBLICATIONCHAPTER - DATA HANDLINGEXERCISE - Think, Discuss And Write
7 Videos
- DATA HANDLINGBOOK - SWAN PUBLICATIONCHAPTER - DATA HANDLINGEXERCISE - Try These
27 Videos
- CUBES AND CUBE ROOTS BOOK - SWAN PUBLICATIONCHAPTER - CUBES AND CUBE ROOTS EXERCISE - EXERCISE 7.2
9 Videos
- DIRECT AND INVERSE PROPORTIONS BOOK - SWAN PUBLICATIONCHAPTER - DIRECT AND INVERSE PROPORTIONS EXERCISE - Exercise 13.2
16 Videos
Similar Questions
If we change the position of any of the bars of a bar graph, would it change the information being conveyed ? Why ?
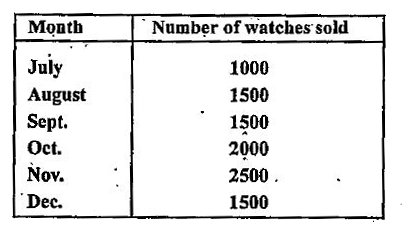
View SolutionDraw an appropriate graph to represent the given information.

View SolutionFind the cube root of each of the following numbers by prime factorisation method : 175616
View SolutionWhich of the following are in inverse proportion : The number of workers on a job and the time to complete the job.
View SolutionWhich of the following are correct chain isomers of butane ? (i)
View SolutionDetermine the point of symmetry of a regular hexagon.
View SolutionMatch the following Column A to Column B

View SolutionMatch the following Column A to Column B

View SolutionMatch the following Column A to Column B

View SolutionThe inequation represented by the graph given below is :
View SolutionThe inequation that best describes the graph given below is _________
View SolutionThe inequation that best describes the following graph is _________
View SolutionWhich inequations represent the shaded region in the given figure
View SolutionIn the given figure, PQRS is a parallelogram. A and B are the mid-point of ¯¯¯¯¯¯PQ and ¯¯¯¯¯SR respectively. If PS=BR, then the quadrilateral ADBC is a…………………… ,
ltimg src="https://d10lpgp6xz60nq.cloudfront.net/physics_images/PS_MATH_IX_C12_E05_020_Q01.png" width="80%"gt
View SolutionIn the chemical reactions,
ltimg src="https://d10lpgp6xz60nq.cloudfront.net/physics_images/JM_10_CHE_P1_E01_009_S01.png" width="80%"gt
the compounds 'A' and 'B' respectively are
View SolutionA bar graph: A display of information using bars of uniform width, their heights being proportional to the respective values.

What is the information given by the bar graph?
View Solution
