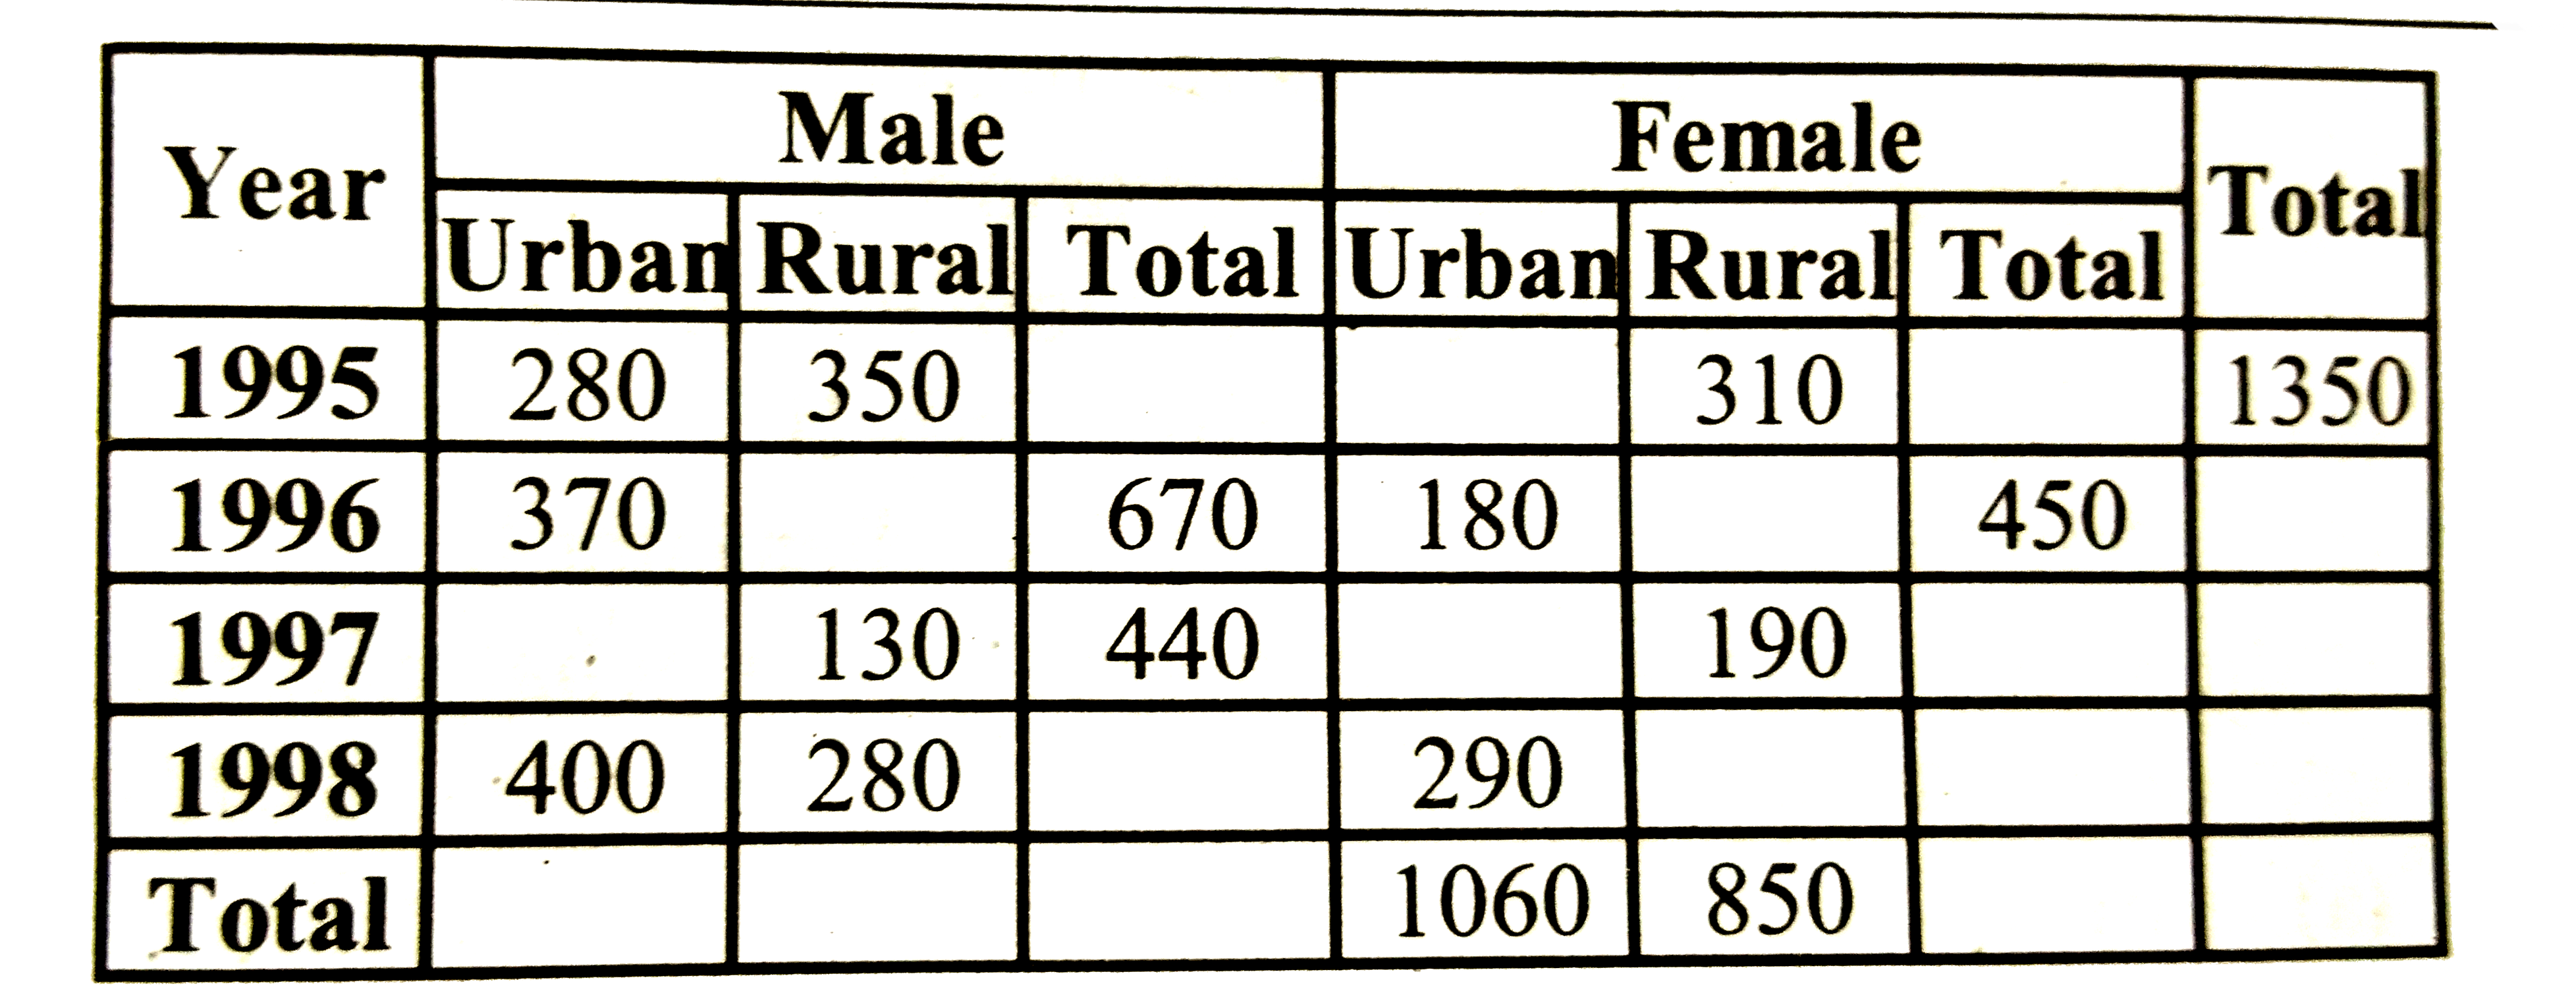
The following bar-diagram shows total number of males and females in five different organisations. Study it carefully to answer the questions.
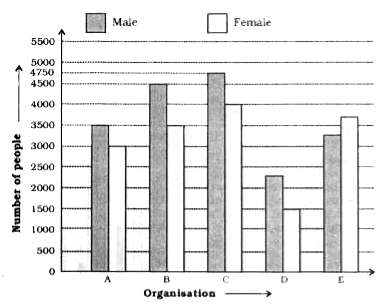
What is the difference between the total number of females and the total number of males from all the organisations together?
2005
2050
2500
2055
The correct Answer is:C
Step by step video, text & image solution for The following bar-diagram shows total number of males and females in five different organisations. Study it carefully to answer the questions. What is the difference between the total number of females and the total number of males from all the organisations together? by Maths experts to help you in doubts & scoring excellent marks in Class 14 exams.
Topper's Solved these Questions
- BOOK - KIRAN PUBLICATIONCHAPTER - STATISTICS AND DATA INTERPRETATIONEXERCISE - TYPE-V38videos
STATISTICS AND DATA INTERPRETATION
- BOOK - KIRAN PUBLICATIONCHAPTER - STATISTICS AND DATA INTERPRETATIONEXERCISE - TYPE-VI86videos
STATISTICS AND DATA INTERPRETATION
- BOOK - KIRAN PUBLICATIONCHAPTER - STATISTICS AND DATA INTERPRETATIONEXERCISE - TYPE-III39videos
STATISTICS AND DATA INTERPRETATION
- BOOK - KIRAN PUBLICATIONCHAPTER - SIMPLIFICATIONEXERCISE - TEST YOURSELF25videos
SIMPLIFICATION
- BOOK - KIRAN PUBLICATIONCHAPTER - TIME AND DISTANCEEXERCISE - Type -XI74videos
TIME AND DISTANCE
Similar Questions
Knowledge Check
- Question 1 - Select One
The following bar-diagram shows total number of males and females in five different organisations. Study it carefully to answer the questions.
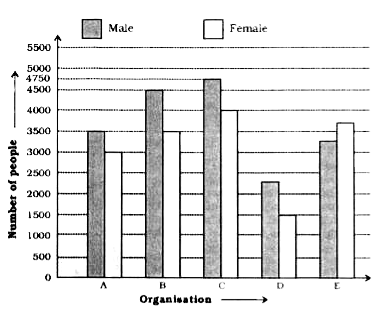
What is the ratio of the number of females from the organisations B and C to the number of males from the organisations D and E?A12:11B12:15C11:15D15:11 - Question 2 - Select One
The following bar-diagram shows total number of males and females in five different organisations. Study it carefully to answer the questions.
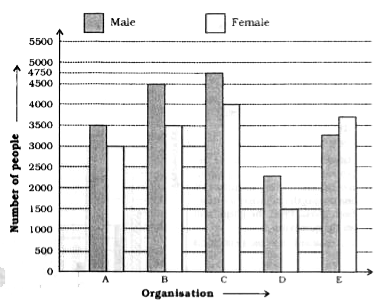
What is the ratio of average number of females from the organisations A, B and C to the average number of males from the organisations C, D and E?A42:41B41:42C40:41D41:40 - Question 3 - Select One
The following bar-diagram shows total number of males and females in five different organisations. Study it carefully to answer the questions.
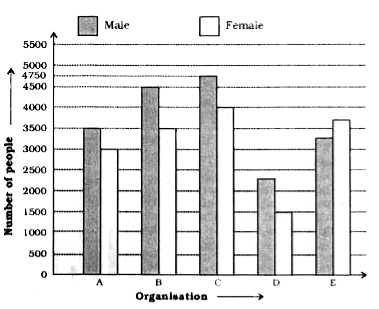
Males from organisations A and B together form what per cent of total number of males from organisations C, D and E together?A78.04%B87.44%C47.08%D74.08%
Directions: The following bar graph shows the number of pages in five different books (viz. A, B, C, D and E). Study the graph carefully and answer the following questions.
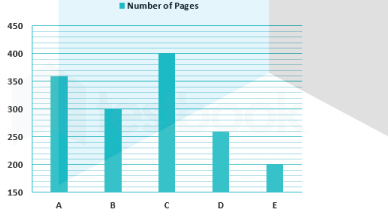
What is the ratio of total number of pages in book B and E together to the total number of pages in book C and D together?View SolutionThe following bar-diagram shows total number of males and females in five different organisations. Study it carefully to answer the questions.
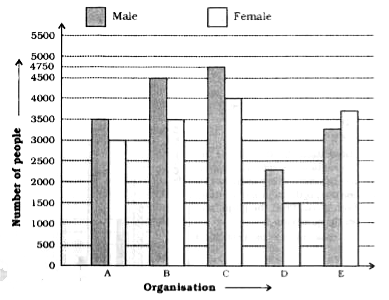
By how much percentage is the average number of females from all the organisations together is more than the number of males in organisation 'D'?View SolutionStudy the bar diagram and answer the questions.
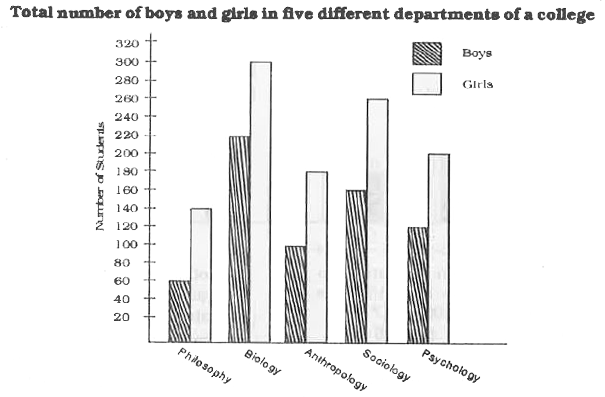
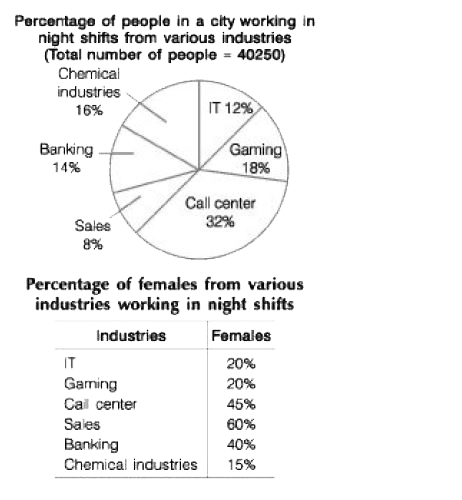
The difference between the total number of bys and the total number of girls from all the Departments together isView SolutionWhat is the difference between the total number of men and the total number of women workingin night shifts from all the industries together?
 View Solution
Study the following graph carefully and answer the questions that follow
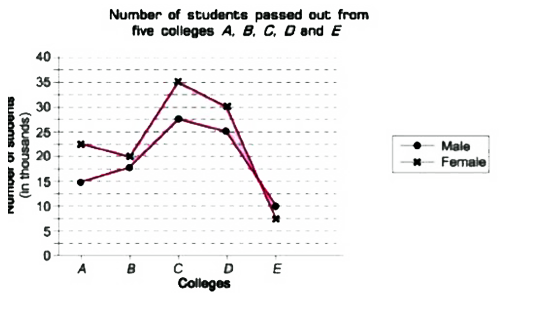
What is the sum of average number of males and average number of passed out from all the colleges together ?View Solution


