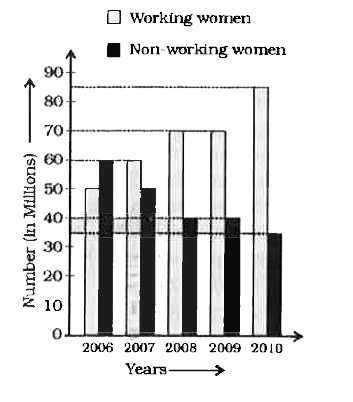
Study the following multiple bar graph carefully and answer the questions.
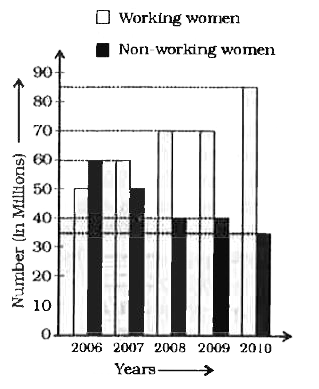
In which year was the difference between the number of working and non-working women the highest?
2007
2008
2009
2010
The correct Answer is:D
Step by step video, text & image solution for Study the following multiple bar graph carefully and answer the questions. In which year was the difference between the number of working and non-working women the highest? by Maths experts to help you in doubts & scoring excellent marks in Class 14 exams.
Topper's Solved these Questions
- BOOK - KIRAN PUBLICATIONCHAPTER - STATISTICS AND DATA INTERPRETATIONEXERCISE - TYPE-V38videos
STATISTICS AND DATA INTERPRETATION
- BOOK - KIRAN PUBLICATIONCHAPTER - STATISTICS AND DATA INTERPRETATIONEXERCISE - TYPE-VI86videos
STATISTICS AND DATA INTERPRETATION
- BOOK - KIRAN PUBLICATIONCHAPTER - STATISTICS AND DATA INTERPRETATIONEXERCISE - TYPE-III39videos
STATISTICS AND DATA INTERPRETATION
- BOOK - KIRAN PUBLICATIONCHAPTER - SIMPLIFICATIONEXERCISE - TEST YOURSELF25videos
SIMPLIFICATION
- BOOK - KIRAN PUBLICATIONCHAPTER - TIME AND DISTANCEEXERCISE - Type -XI74videos
TIME AND DISTANCE
Similar Questions
Read the following graph carefully and answer the questions given below:
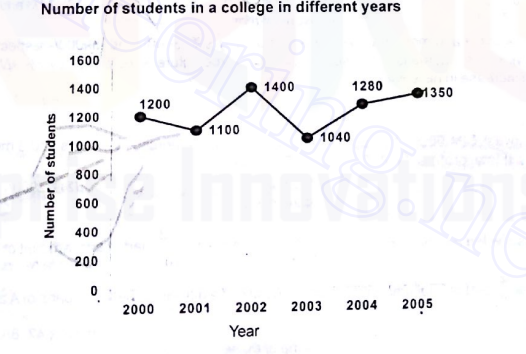
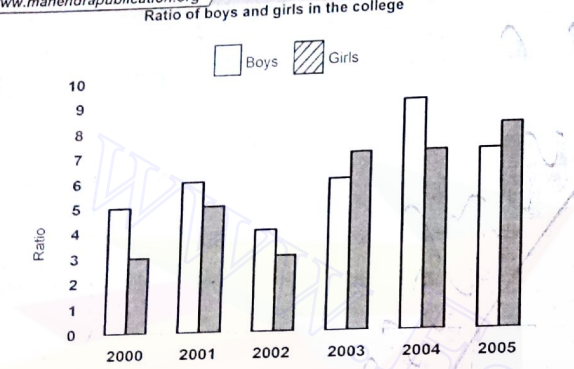
What is the difference between the number of boys and girls in the year 2004 ?View SolutionStudy the following graph carefully and answer the given questions.
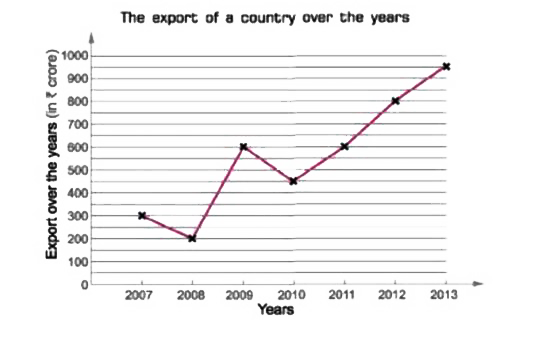
What is the difference in exports in the years 2009 and 2010 ?View Solution
Knowledge Check
- Question 1 - Select One
Study the following multiple bar graph carefully and answer the questions.

In which year was the difference between the number of working and non-working women the highest?A2007B2008C2009D2010 - Question 2 - Select One
Study the following multiple bar graph carefully and answer the questions.
In which year or years, the difference between the number of working and non-working women the lowest ?A2006 and 2007B2007 and 2008COnly 2006DOnly 2007 - Question 3 - Select One
Study the following line graph and answer the questions.
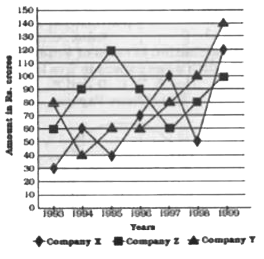
In which year was the difference between the exports of companies Y and Z maximum ?A1994B1997C1995D1996
Study the following multiple bar graph carefully and answer the questions.
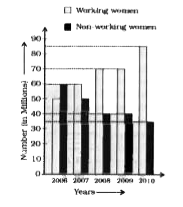
What is the ratio of number of working women to the non-working women in the year 2009 ?View SolutionStudy the following graph carefully and answer the following questions -----
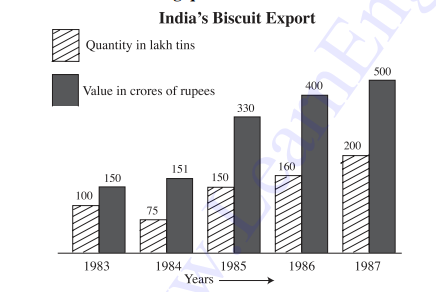
What was the difference between the tins exported in 1985 and 1986 ?View SolutionStudy the following graph carefully and answer the question given below-----
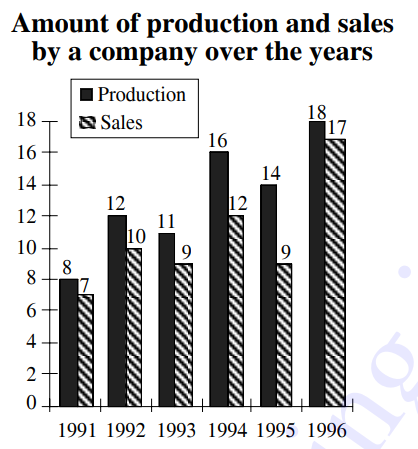
What was the difference between the sales of 1992 and 1995 ?View SolutionStudy the following graph carefully and answer the questions given below
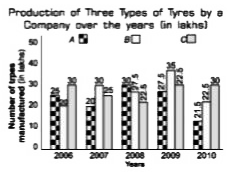
What was the difference between the number of B type tyres manufactured in 2008 and 2009?View SolutionStudy the following bar graph and answer the question that follows.
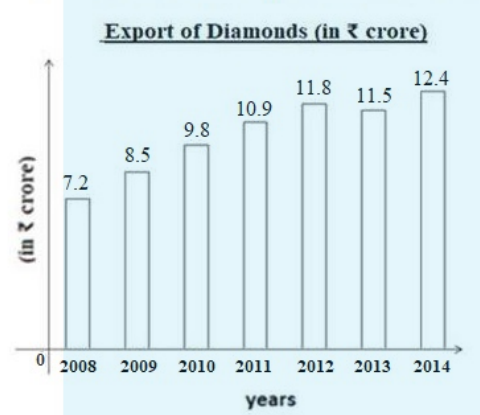
In which year was the maximin percentage increase in diamonds exports compared to the previous year?View Solution

