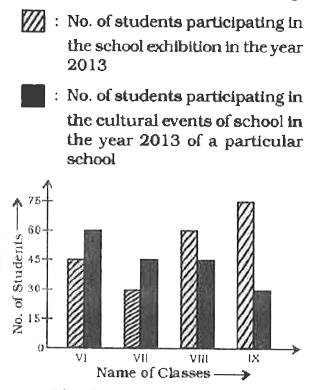
Study the double bar graph given below and answer the questions.
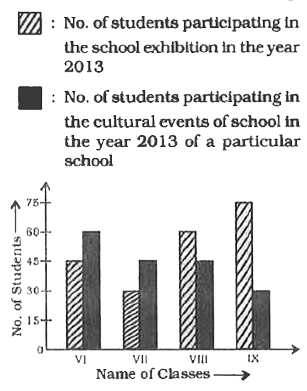
The average of the number of students participating in exhibition is
48.75
52.5
45
50
The correct Answer is:B
Step by step video, text & image solution for Study the double bar graph given below and answer the questions. The average of the number of students participating in exhibition is by Maths experts to help you in doubts & scoring excellent marks in Class 14 exams.
Topper's Solved these Questions
- BOOK - KIRAN PUBLICATIONCHAPTER - STATISTICS AND DATA INTERPRETATIONEXERCISE - TYPE-V38videos
STATISTICS AND DATA INTERPRETATION
- BOOK - KIRAN PUBLICATIONCHAPTER - STATISTICS AND DATA INTERPRETATIONEXERCISE - TYPE-VI86videos
STATISTICS AND DATA INTERPRETATION
- BOOK - KIRAN PUBLICATIONCHAPTER - STATISTICS AND DATA INTERPRETATIONEXERCISE - TYPE-III39videos
STATISTICS AND DATA INTERPRETATION
- BOOK - KIRAN PUBLICATIONCHAPTER - SIMPLIFICATIONEXERCISE - TEST YOURSELF25videos
SIMPLIFICATION
- BOOK - KIRAN PUBLICATIONCHAPTER - TIME AND DISTANCEEXERCISE - Type -XI74videos
TIME AND DISTANCE
Similar Questions
Knowledge Check
- Question 1 - Select One
Study the double bar graph given below and answer the questions.
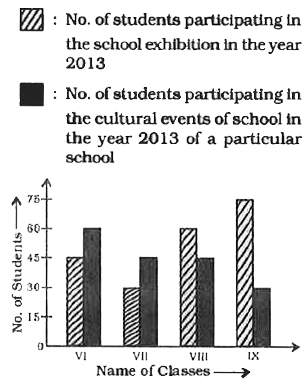
The average of the number of students participating in cultural events isA48.75B52.5C45D50 - Question 2 - Select One
Study the double bar graph given below and answer the question.
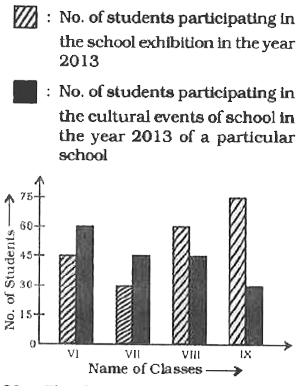
The class having maximum number of participants in exhibition isAClass IXBClass VIIICClass VIIDClass VI - Question 3 - Select One
Study the double bar graph given below and answer the questions.
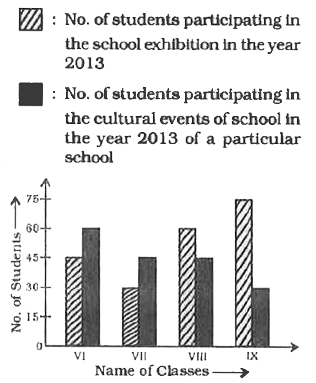
The percentage of students of class VIII participanting in cultural event out of total participants of cultural event isA30%B25%C35%D40%
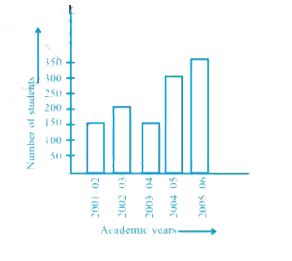
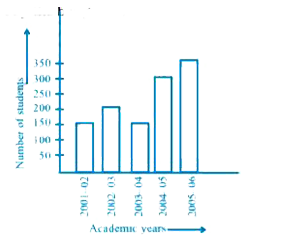
Read the bar graph given below and answer the following questions:
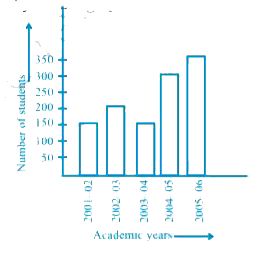
In which year did the number of students decrease as compared to previous year?View SolutionRead the bar graph given below and answer the following questions:
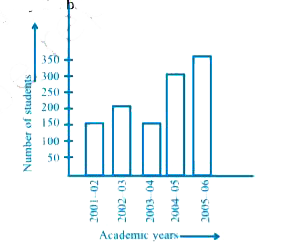
In which year is the increase in number of students maximum as compared to the previous year?View SolutionStudy the double bar graph given below and answer the questions.
The ratio of the participants in exhibition of class IX with the total participants of class IX isView SolutionStudy the following bar graph and answer the question that follows.
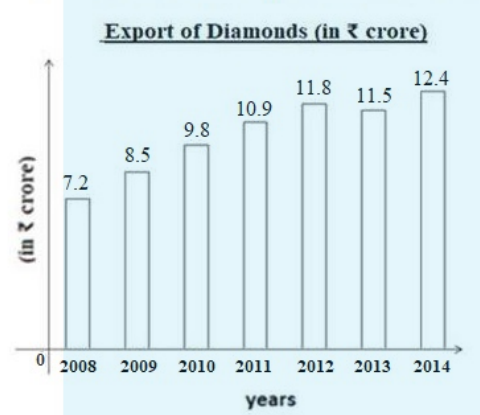
In which year was the maximin percentage increase in diamonds exports compared to the previous year?View SolutionThe bar graph shows the number of students (in hundreds) admitted and passed out per year in a college during the years 2010 to 2014.
Study the bar graph and answer the question.
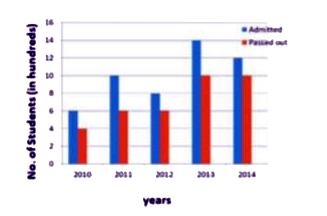
The ratio of the number of students admitted in the year 2012 to the average number of students passed out inthe years 2013 and 2014 isView Solution


