Study the following Bar Graph and answer the questions. The Bar Graph gives the annual rates of inflation in percentage for 1975 and 1987.
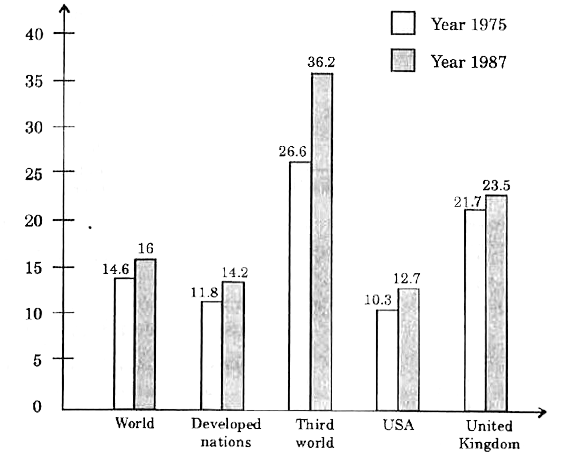
Comparing the figures for USA vis-à-vis the developed nation, it can be concluded that.
USA had better control on inflation
Developed nations had better control on inflation
The inflation rate continues to be the same for USA and developed nations
No conclusions can be drawn
The correct Answer is:A
Step by step video, text & image solution for Study the following Bar Graph and answer the questions. The Bar Graph gives the annual rates of inflation in percentage for 1975 and 1987. Comparing the figures for USA vis-à-vis the developed nation, it can be concluded that. by Maths experts to help you in doubts & scoring excellent marks in Class 14 exams.
Topper's Solved these Questions
- BOOK - KIRAN PUBLICATIONCHAPTER - STATISTICS AND DATA INTERPRETATIONEXERCISE - TYPE-V38videos
STATISTICS AND DATA INTERPRETATION
- BOOK - KIRAN PUBLICATIONCHAPTER - STATISTICS AND DATA INTERPRETATIONEXERCISE - TYPE-VI86videos
STATISTICS AND DATA INTERPRETATION
- BOOK - KIRAN PUBLICATIONCHAPTER - STATISTICS AND DATA INTERPRETATIONEXERCISE - TYPE-III39videos
STATISTICS AND DATA INTERPRETATION
- BOOK - KIRAN PUBLICATIONCHAPTER - SIMPLIFICATIONEXERCISE - TEST YOURSELF25videos
SIMPLIFICATION
- BOOK - KIRAN PUBLICATIONCHAPTER - TIME AND DISTANCEEXERCISE - Type -XI74videos
TIME AND DISTANCE
Similar Questions
Study the following Bar graph and answer the question. The Bar graph gives the annual rates of inflation in percentages for 1975 and 1987:
निम्नलिखित बार-ग्राफ का अध्ययन करें और प्रश्नों का उत्तर दें। बार-ग्राफ में वर्ष 1975 से 1987 तक प्रतिशत में मुद्रा स्फीति की वार्षिक दर प्रतिशत में दी गई है :
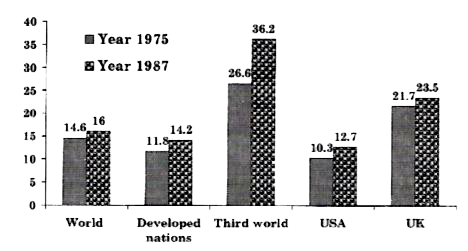
The change in rate of inflation was least in which of the following.
मुद्रास्फीति के परिवर्तन की निम्नतम दर इन में से कहाँ थी?View SolutionStudy the bar graph and answer the following questions.
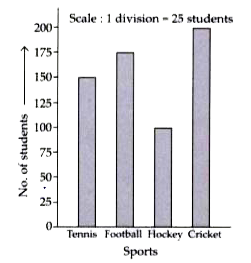
Which is the most popular sport ?View Solution
Knowledge Check
- Question 1 - Select One
Study the following bar graph and answer the question that follows.
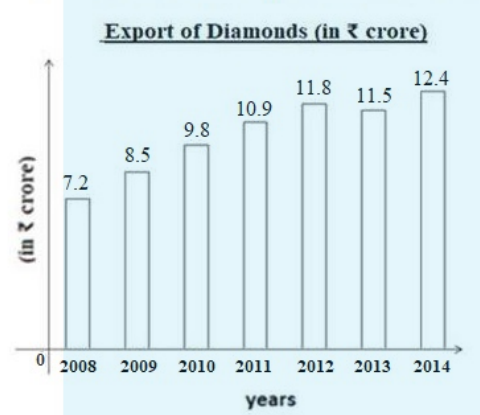
In which year was the maximin percentage increase in diamonds exports compared to the previous year?A2014B2009C2010D2012 - Question 2 - Select One
Study the following Bar Graph and answer the questions. The Bar Graph gives the annual rates of inflation in percentage for 1975 and 1987.
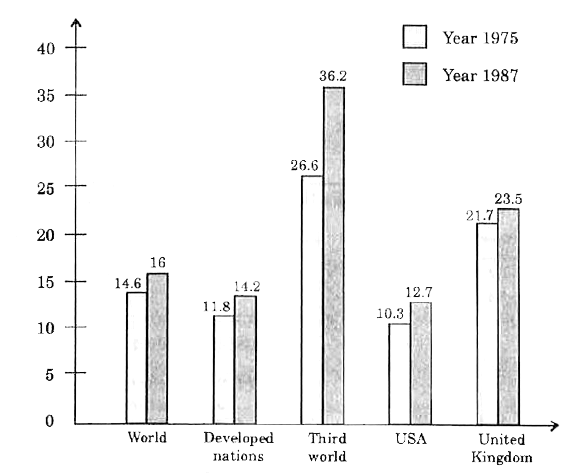
The change in rate of inflation was least in which of the following ?ADeveloped NationsBUnited KingdomCWorldDThird world - Question 3 - Select One
Study the following Bar Graph and answer the questions. The Bar Graph gives the annual rates of inflation in percentage for 1975 and 1987.
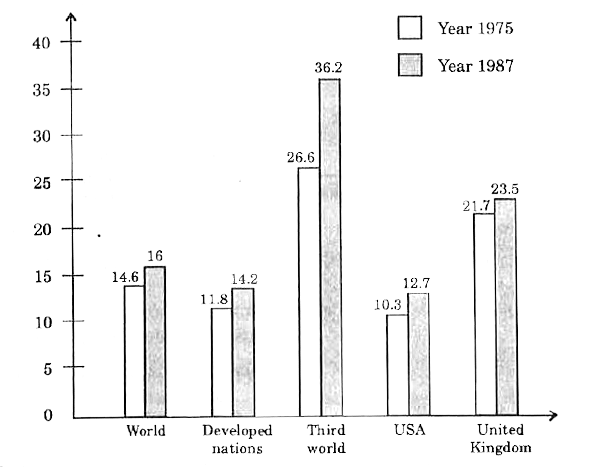
In the year 1987, the inflation rate in the third world countries vis-à-vis the world jumped approximately byA135%B126%C122%D200%
Study the following bar graph carefully to answer the questions.
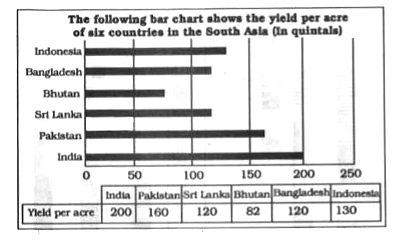
The yield per acre of India is what percent more than that of Pakistan?View SolutionStudy the following bar-graph carefully and answer the question:
The average export of pearls for the given period (in crores Rs) isView SolutionStudy the bar graph and answer the following questions.
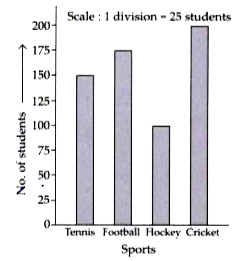
Which sport is preferred least ?View SolutionStudy the following Bar Graph and answer the questions. The Bar Graph gives the annual rates of inflation in percentage for 1975 and 1987.
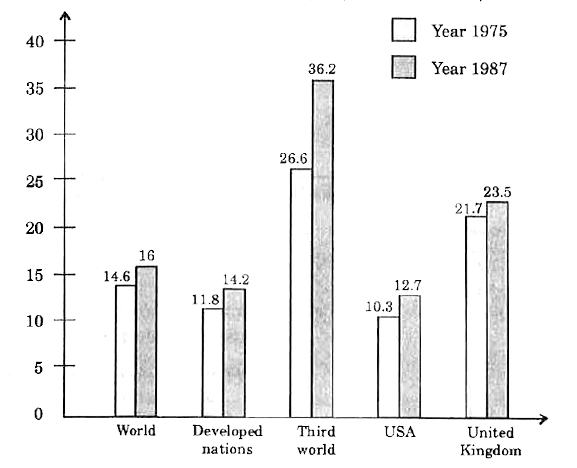
From 1975 to 1987, inflation rate increased in the third world countries approximately byView SolutionStudy the following bar graph and answer the question that follows.
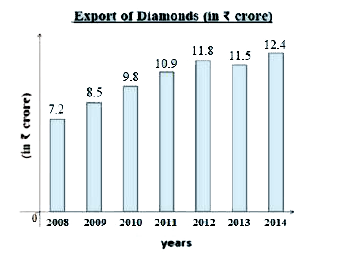
In which year was the maximum percentage increase in diamond exports compared to the previous year?View Solution

