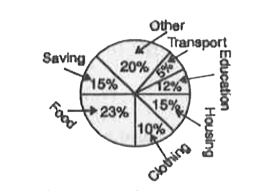
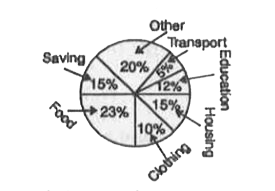
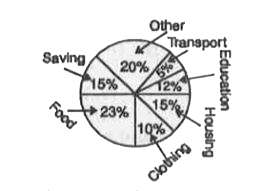
Read the following pie-chart to answer the questions given below it.
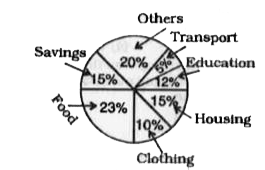
Per cent of money spent by a family on various items during 1998
If the total expenditure of the family for the year 1998 was Rs 46000/-, the family saved during the year.
Rs 1500/-
Rs 15000/-
Rs 6900/-
Rs 3067/- app.
The correct Answer is:C
Step by step video, text & image solution for Read the following pie-chart to answer the questions given below it. Per cent of money spent by a family on various items during 1998 If the total expenditure of the family for the year 1998 was Rs 46000/-, the family saved during the year. by Maths experts to help you in doubts & scoring excellent marks in Class 14 exams.
Updated on:21/07/2023Topper's Solved these Questions
- STATISTICS AND DATA INTERPRETATIONBOOK - KIRAN PUBLICATIONCHAPTER - STATISTICS AND DATA INTERPRETATIONEXERCISE - TYPE-VIII
8 Videos
- STATISTICS AND DATA INTERPRETATIONBOOK - KIRAN PUBLICATIONCHAPTER - STATISTICS AND DATA INTERPRETATIONEXERCISE - TYPE-VI
86 Videos
- SIMPLIFICATIONBOOK - KIRAN PUBLICATIONCHAPTER - SIMPLIFICATIONEXERCISE - TEST YOURSELF
25 Videos
- TIME AND DISTANCEBOOK - KIRAN PUBLICATIONCHAPTER - TIME AND DISTANCEEXERCISE - Type -XI
74 Videos
Similar Questions
Study the diagram and answer the questions.
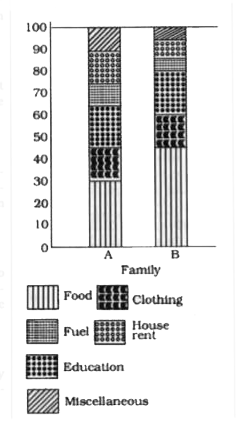
If the total annual expenditure of family B is Rs 10,000 then money spent on clothes during the year is
View SolutionRead the following pie-chart to answer the questions given below it.
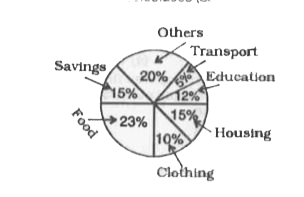
Per cent of money spent by a family on various items during 1998
If the total amount spent was Rs 46000/-, how much was spent on clothing and housing together?
View Solution
Knowledge Check
Read the following pie-chart to answer the questions given below it.
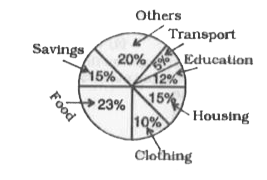
Per cent of money spent by a family on various items during 1998
If the total amount spent during the year 1998 was Rs 46000 /-, the amount spent on food, was :ARs 2000/-BRs 10580/-CRs 23000/-DRs 2300/-The circle graph given here shows the spendings by a family on various items during the year 1998. Study the graph and answer the following questions.
(Per cent of money spent by a family on various items during
If the total expenditure of the family for the year 1998 was Rs. 46000/-, the family saved during the year.ARs. 1500/-BRs. 15000/-CRs. 6900/-DRs. 3067/-approxRead the following pie-chart to answer the questions given below it.
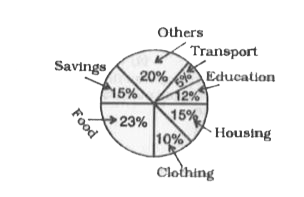
Per cent of money spent by a family on various items during 1998
Graph shows that the maximmum amount was spent on :AFoodBHousingCClothingDOthers
Read the following pie-chart to answer the questions given below it.
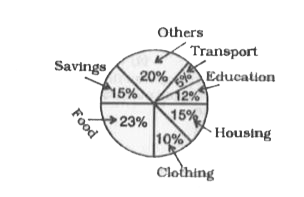
Per cent of money spent by a family on various items during 1998
The ratio of the total amount of money spent on housing to that spent on education was :
View SolutionThe circle graph given here shows the spendings by a family on various items during the year 1998. Study the graph and answer the following questions.
(Per cent of money spent by a family on various items during
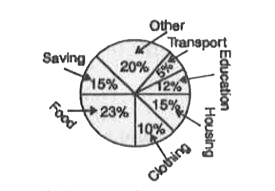
If the total amount spent during the year 1998 was Rs. 46000/-, the amount spent on food, was :
View SolutionThe circle graph given here shows the spendings by a family on various items during the year 1998. Study the graph and answer the following questions.
(Per cent of money spent by a family on various items during
If the total amount spent was Rs. 46000/-, how much · was spent on clothing and housing together?
View SolutionThe circle graph given here shows the spendings by a family on various items during the year 1998. Study the graph and answer the following questions.
(Per cent of money spent by a family on various items during
The ratio of the total amount of money spent on housing to that spent on education was :
View SolutionStudy the chart and answer the question based, on the pie chart.
The pie chart given below shows expenditures incurred by a family on various items and savings in a month. Savings of the family is month. Savings of the family is ₹ 8,000 in a month.
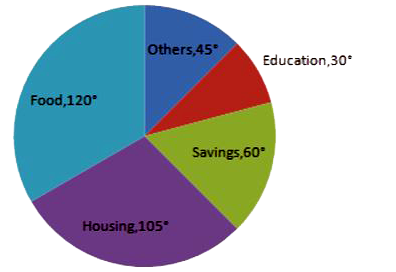
How much more amount is spent on food than on housing ?
View Solution
