The pie chart given below shows the percentage of time taken by different processes in making a car
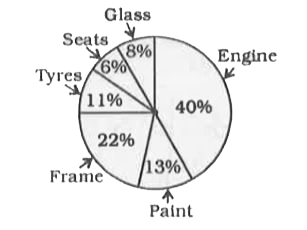
15% of total time is spent on quanlity check and this time is equalty check and this time is equally taken from all other processes . So what will be the new sectorial angle (in degrees) made by total time of seats and glass ?
28.6
32.4
35.8
31.6
Step by step video & image solution for The pie chart given below shows the percentage of time taken by different processes in making a car 15% of total time is spent on quanlity check and this time is equalty check and this time is equally taken from all other processes . So what will be the new sectorial angle (in degrees) made by total time of seats and glass ? by Maths experts to help you in doubts & scoring excellent marks in Class 14 exams.
Updated on:21/07/2023Topper's Solved these Questions
- STATISTICS AND DATA INTERPRETATIONBOOK - KIRAN PUBLICATIONCHAPTER - STATISTICS AND DATA INTERPRETATIONEXERCISE - TYPE-VIII
8 Videos
- STATISTICS AND DATA INTERPRETATIONBOOK - KIRAN PUBLICATIONCHAPTER - STATISTICS AND DATA INTERPRETATIONEXERCISE - TYPE-VI
86 Videos
- SIMPLIFICATIONBOOK - KIRAN PUBLICATIONCHAPTER - SIMPLIFICATIONEXERCISE - TEST YOURSELF
25 Videos
- TIME AND DISTANCEBOOK - KIRAN PUBLICATIONCHAPTER - TIME AND DISTANCEEXERCISE - Type -XI
74 Videos
Similar Questions
The pie chart given below shows the percentage of time taken by different processes in making a car

time taken in seats is 192 hours , what is the time taken (in hours ) in glass ?
View SolutionThe pie chart given below shows the percentage of time taken by different processes in making a car

If total time taken to make a car is 300 hours , what is the total time (in hours) taken in paint and frame ?
View Solution
Knowledge Check
The pie chart given below shows the percentage of time taken by different processes in making a car

time taken in seats is 192 hours , what is the time taken (in hours ) in glass ?A256B352C416D278The pie-chart given below shows the percentage of time taken by different processes in making a car.
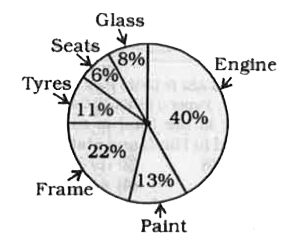
If total time taken to make a car is 300 hours, what is the total tme (in hours) taken in paint and frame?A99B72C105D66The pie chart given below shows the percentage of time taken by different processes in making a car

If total time taken in engine and tyres is 127 . 5 hours , what is time difference (in hours) in time taken by frame and glass respectively ?A27.5B12.5C40D35
The pie chart given below shows the percentage of time taken by different processes in making a car

If total time taken in engine and tyres is 127 . 5 hours , what is time difference (in hours) in time taken by frame and glass respectively ?
View SolutionThe pie chart given below shows the time taken in 7 different procedures J1, J2, J3, J4, J5, J6 and J7 in making a car as a percentage of total time taken. The total time taken in making one car is 1200 hours.
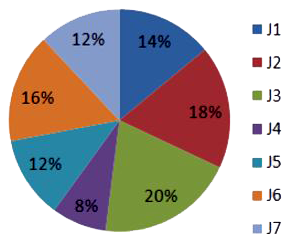
What will be the total taken n procedures J2 and J5?
View SolutionThe pie chart given below shows the time taken in 7 different procedures J1, J2, J3, J4, J5, J6 and J7 in making a car as a percentage of total time taken. The total time taken in making one car is 1200 hours.
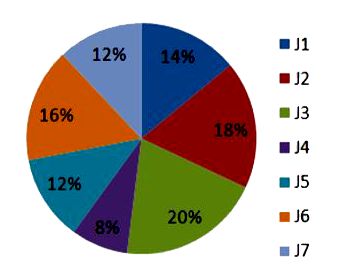
What is the difference between the time taken in processes J1 and J4
View SolutionThe pie chart given below shows the time taken in 7 different procedures J1, J2, J3, J4, J5, J6 and J7 in making a car as a percentage of total time taken. The total time taken in making one car is 1200 hours.
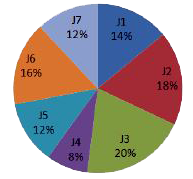
What is the average time taken in procedures J3, J6 and J7?
View SolutionThe pie-chart below shows percentage of money spent on different sports in a state in a particular year. The total amount spent on all sports is Rs. 150 crore.
Answer the following questins on the basis of data given in the chart below.
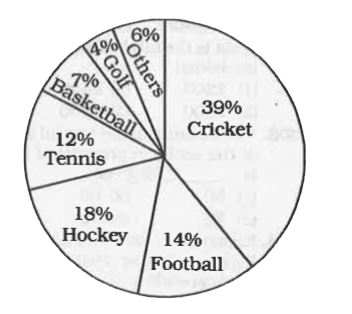
What is the amount of mmoney spent on Cricket and Hockey together?
View Solution
