The given pie chart shows the monthly expenditure on various items and monthly savings of a household. The same distribution is followed for all the months of the year.
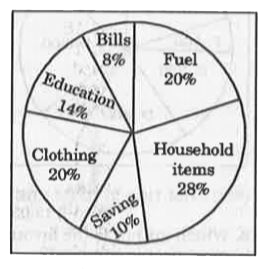
If the difference in monthly expenditure on fuel and bills is Rs. 4800, then what is the annual income of household?
660000
600000
540000
480000
The correct Answer is:D
Step by step video, text & image solution for The given pie chart shows the monthly expenditure on various items and monthly savings of a household. The same distribution is followed for all the months of the year. If the difference in monthly expenditure on fuel and bills is Rs. 4800, then what is the annual income of household? by Maths experts to help you in doubts & scoring excellent marks in Class 14 exams.
Topper's Solved these Questions
- BOOK - KIRAN PUBLICATIONCHAPTER - STATISTICS AND DATA INTERPRETATIONEXERCISE - TYPE-VIII8videos
STATISTICS AND DATA INTERPRETATION
- BOOK - KIRAN PUBLICATIONCHAPTER - STATISTICS AND DATA INTERPRETATIONEXERCISE - TYPE-VI86videos
STATISTICS AND DATA INTERPRETATION
- BOOK - KIRAN PUBLICATIONCHAPTER - SIMPLIFICATIONEXERCISE - TEST YOURSELF25videos
SIMPLIFICATION
- BOOK - KIRAN PUBLICATIONCHAPTER - TIME AND DISTANCEEXERCISE - Type -XI74videos
TIME AND DISTANCE
Similar Questions
Knowledge Check
- Question 1 - Select One
The given pie chart shows the monthly expenditure on various items and monthly savings of a household. The same distribution is followed for all the months of the year.
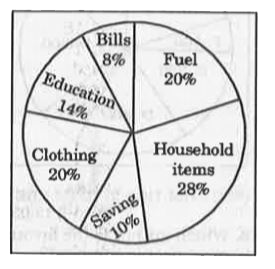
If the difference in monthly expenditure on clothing and education is Rs. 9000, then what is the different (in Rs.) in yearly saving and yearly expenditure on bills?A64000B76000C36000D48000 - Question 2 - Select One
The given pie chart shows the monthly expenditure on various items and monthly savings of a household. The same distribution is followed for all the months of the year.

If the difference in monthly expenditure on clothing and education is Rs. 9000, then what is the different (in Rs.) in yearly saving and yearly expenditure on bills?A64000B76000C36000D48000 - Question 3 - Select One
The given pie chart shows the monthly expenditure on various items and monthly savings of a household. The same distribution is followed for all the months of the year.
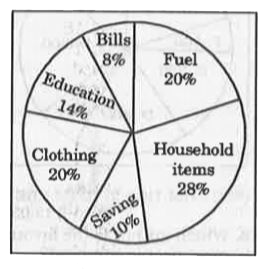
If monthly income is Rs. 50000, then how much is spent (in Rs.) on fuel?A12000B10000C13500D15000
The given pie chart shows the monthly expenditure on various items and monthly savings of a household. The same distribution is followed for all the months of the year.

If monthly income is Rs. 50000, then how much is spent (in Rs.) on fuel?View SolutionThe given pie chart shows the monthly expenditure on various items and monthly savings of a household. The same distribution is followed for all the months of the year.
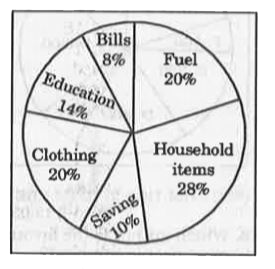
If an amount of Rs. 2400 is saved per month, then what is the monthly salary (in Rs.) of the household ?View SolutionThe given pie chart shows the monthly expenditure on various items and monthly savings of a household. The same distribution is followed for all the months of the year.
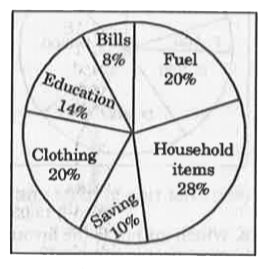
If monthly income is Rs. 65000, then what is the difference ()in Rs.) between expenditure on household items and clothing?View SolutionThe given pie chart shows the monthly expenditure on various items and monthly savings of a household. The same distribution is followed for all the months of the year.

If an amount of Rs. 2400 is saved per month, then what is the monthly salary (in Rs.) of the household ?View SolutionThe given pie chart shows the monthly expenditure on various items and monthly savings of a household. The same distribution is followed for all the months of the year.

If monthly income is Rs. 65000, then what is the difference ()in Rs.) between expenditure on household items and clothing?View Solution
